Figures & data
Table 1. Exemplary measurements: the table shows the settings for the set of data presented in .
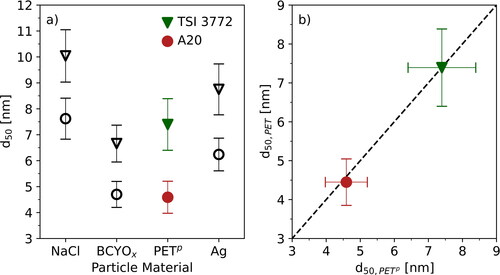
Table 2. 50% cutoff diameters: The table shows the 50% cutoff diameters (d50) measured for PETp and PET using the TSI 3772 and the Airmodus A20.
Figure 1. Schematic of the experimental setup: A tube furnace was used for particle generation. The aerosol exiting the tube furnace is brought into a stable charging state using a soft X-ray charger and fed into a DMA that is operated in analyzer-mode. The particles are detected using a Faraday Cup Electrometer and a CPC.
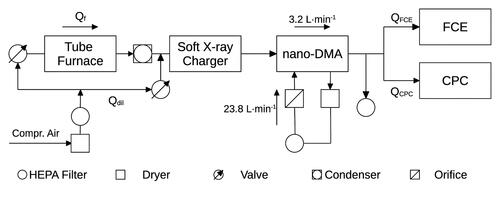
Figure 2. Set of particle number size distributions: The figure shows a set of representative particle number size distributions for the investigated materials. The exact settings for every distribution are presented in . Panel (a) shows the data measured with PETp and LDPEp. Panel (b) shows the results for PET, LDPE, and PP. The higher-purity materials are marked with “p”.
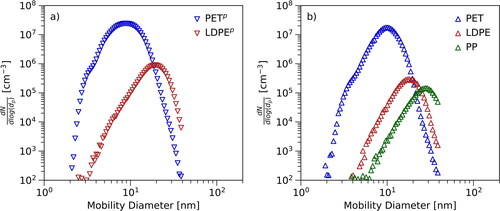
Figure 3. Stability: The figure shows the temporal evolution of the particle number size distributions for two different materials. The curves correspond to different dwell times of the materials in the tube furnace. Panel (a) corresponds to measurement using PET and a set point temperature of 180 °C. Panel (b) shows the temporal evolution of the size distribution measured with PETp at 220 °C.
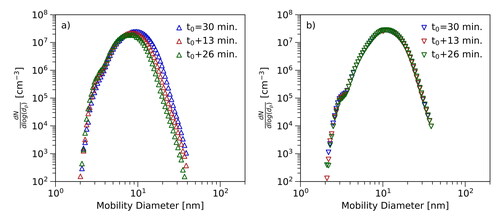
Figure 4. Effects of temperature, flow rates and amount of material: The figure shows the influence of different flow rates (panel (a), PETp, 200 °C), amounts of material (panel (b), PETp, 200 °C) and set point temperatures (panel (c), PETp, 160–200 °C). Panel (d) presents the results of the direct comparison between PETp and PET using identical settings.
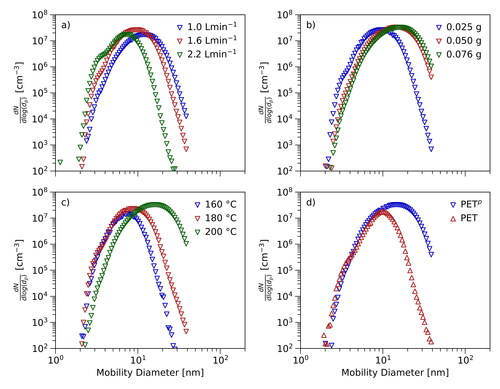
Figure 5. 50% cutoff diameters: The figure presents the results of the measurements of the 50% cutoff diameter for PETp and PET using the TSI 3772 and Airmodus A20 as particle detectors. The triangles correspond to the TSI 3772, the rings to the Airmodus A20. The black data points correspond to the results of Wlasits et al. (Citation2020). Panel (a) shows the comparison of the 50% cutoff diameters for PETp to the aforementioned study. Panel (b) presents the 50% cutoff diameters for both CPCs based on measurements using PETp and PET.