Figures & data
Figure 1. Diagram of the configuration of a 2D computational domain for particle passive transfer and resuspension.
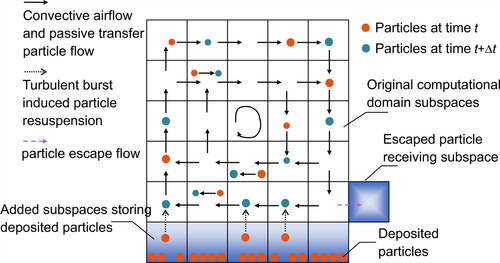
Figure 2. Diagram of turbulent bursts on particle laden surface of a single subspace, the left part shows the top impingement view of several bursts and the right part shows the front view of a single burst.
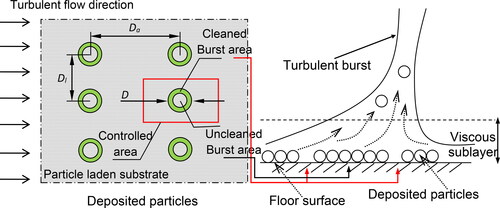
Figure 3. Configuration of the ventilation duct for model validation Case 1 (particles are uniformly deposited on the floor surface).
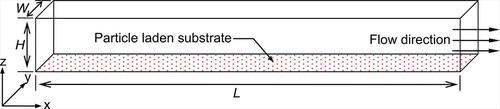
Figure 4. Numerical procedure of particle phase simulation by using the proposed model.
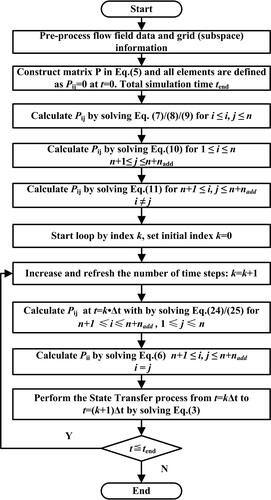
Figure 5. Comparison of particle resuspension rate between simulation/modeling results and experimental data in validation Case 1 for 4.1 μm (left part) and 9.6 μm (right part) particles under various mainstream velocities (a) and (b) 3 m/s, (c) and (d) 4.5 m/s, and (e) and (f) 8 m/s.
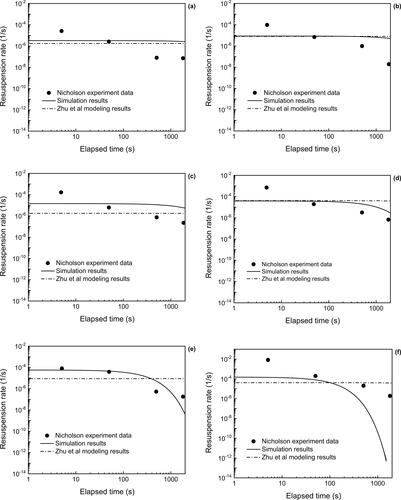
Figure 6. Comparison of particle resuspension rates between simulation results and experimental data in validation Case 2 for different wind speeds at 990 s, 2790 s, 6390 s, and 13590 s.
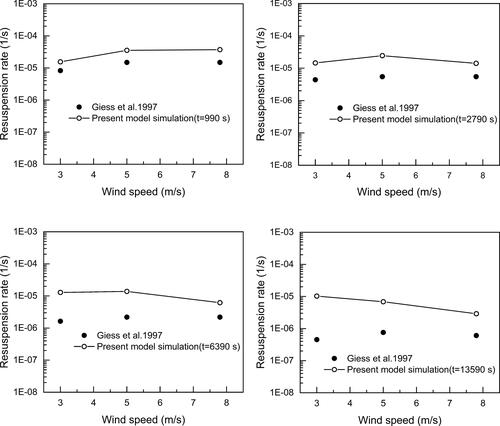
Figure 7. Effects of resuspension fraction of a single turbulent burst on resuspension rate for 4.1 μm (left part) and 9.6 μm (right part) particles under various mainstream velocities (a) and (b) 3 m/s, (c) and (d) 4.5 m/s, and (e) and (f) 8 m/s.
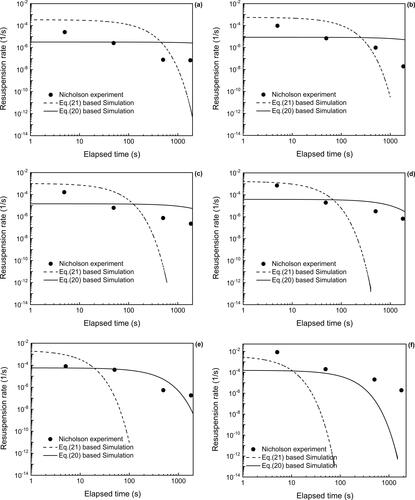
Figure 8. Effects of particle size on resuspension rate under mainstream velocity of 4.5 m/s.
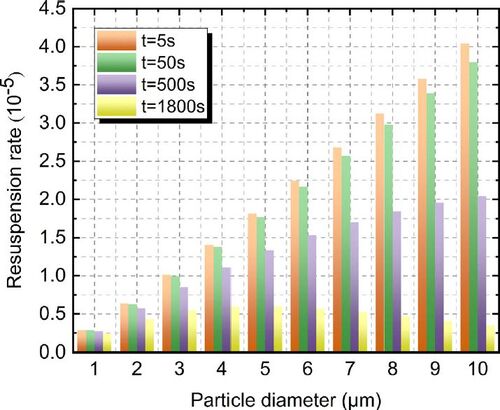
Figure 9. Effects of particle size on resuspension rate under mainstream velocity of 8 m/s.
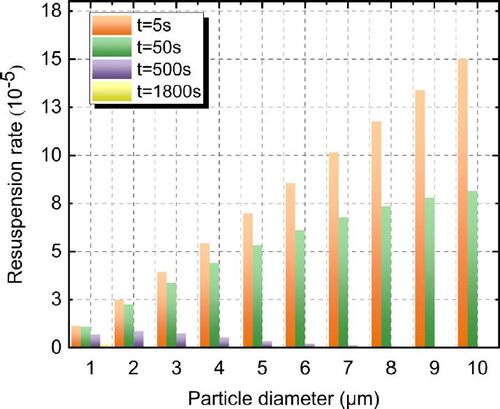
Figure 10. Effects of mainstream velocity on resuspension rate of 9.6 μm particles.
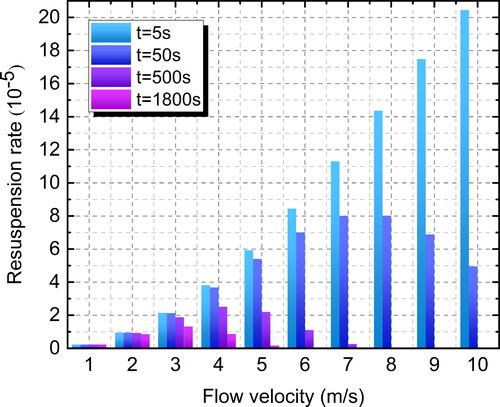
Figure 11. Effects of mainstream velocity on resuspension rates of 4.1 μm particles.
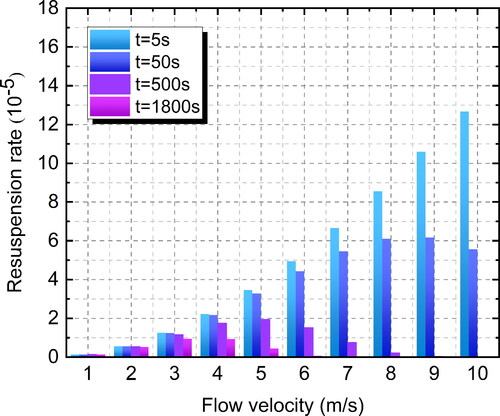
Figure 12. Evolution of overall deposited, resuspended, escaped 4.1 μm particle fractions under the velocity of 8 m/s.
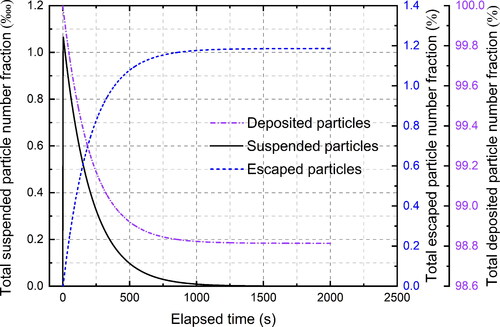
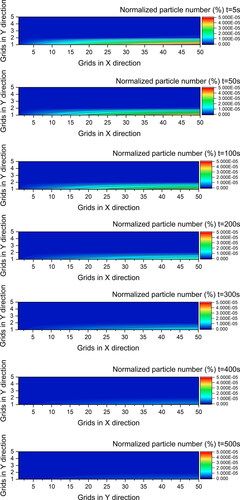
Figure 13. Resuspended 4.1 μm particle numbers in cells of y = 0.5 central panel under mainstream velocity of 8 m/s from 5 s to 500 s.