Figures & data
Figure 1. (a) Schematic diagram of an ordinary experimental setup for studying the acoustophoretic particle sorting inside a microchannel; (b) side view of the experimental setup showing the cross-sectional shape of the microchannel.
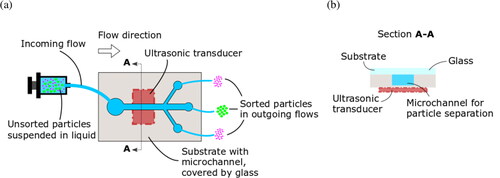
Figure 2. Simulation domains of the five studied cases with the coordinate system employed in this numerical study.
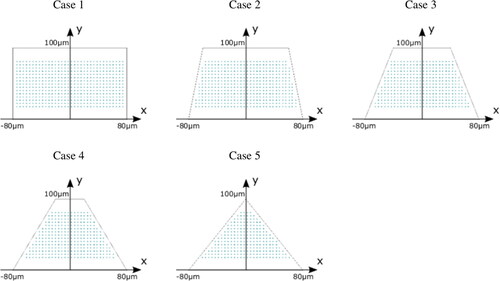
Table 1. The material parameters used for water at 25 °C and polystyrene Spigarelli et al. (Citation2020).
Figure 3. The grid analysis results: (a) the first-order pressure (), and (b) the second-order velocity (
).
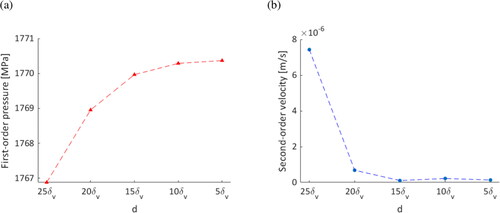
Figure 4. The model validation results: (a) first-order horizontal velocity component obtained at (b) time-averaged second-order velocity (the color plot shows the magnitude, and the arrows indicate the direction); (c) particle displacement changes with time.
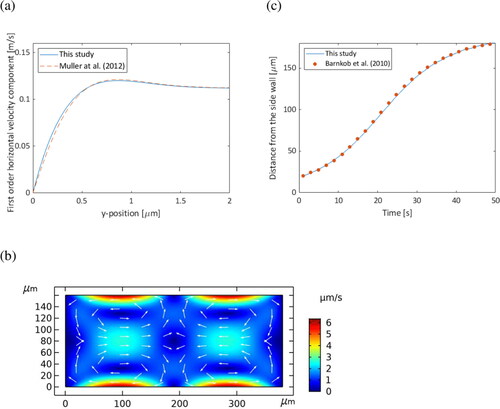
Table 2. A comparison between the results obtained in this study and the study conducted by Muller et al. (Citation2012).
Table 3. Acoustic pressure amplitude on the top and bottom walls of the microchannel.
Figure 5. Acoustic pressure field in the five studied cases.
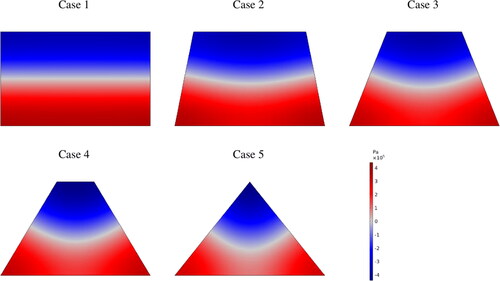
Figure 6. Acoustic streaming pattern in the five studied cases.
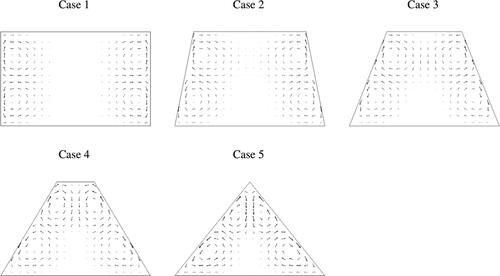
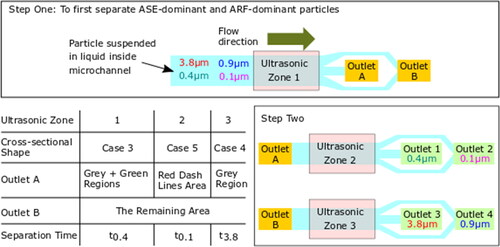
Figure 7. The end location of 3.8 µm, 0.9 µm, 0.4 µm, and 0.1 µm particles.
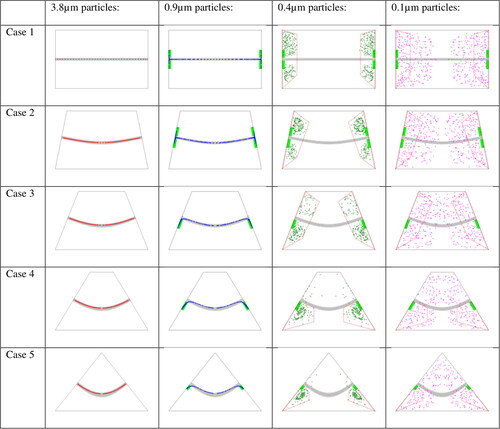
Table 4. The settling time of the 3.8 µm, 0.9 µm, 0.4 µm, and 0.1 µm particles in Case 1 to Case 5.
Figure 8. Content of the samples collected from Outlet 1 and Outlet 2 in the four events.
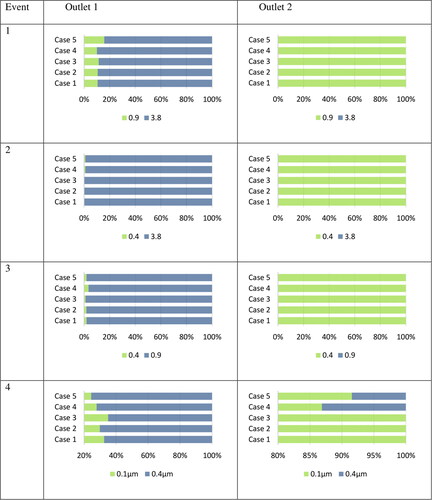
Figure 9. Schematic diagram of the particle sorting system using ASE.