Figures & data
Figure 1. The structure of the (a) EAG system, (b) SMAC, and (c) NTCC.
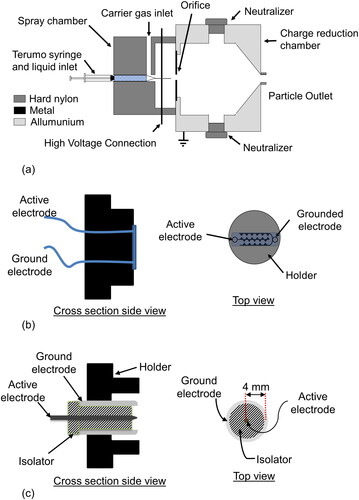
Figure 2. (a) Airflow supply for measuring (b) ion concentration and (c) ion mobility distribution produced by the neutralizer in the reduction chamber.
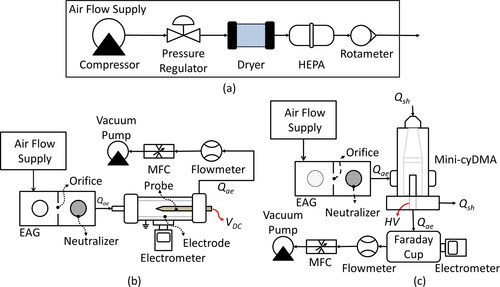
Figure 3. Experiment setup for optimizing the EAG system and evaluating the charge reduction performance.
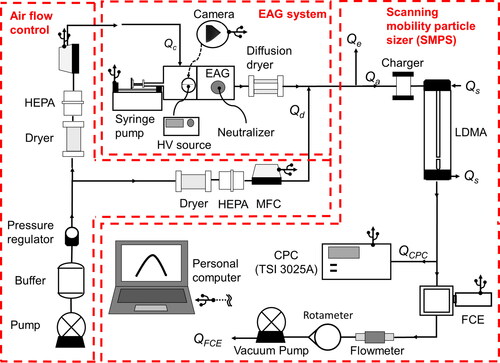
Figure 4. The generated (a) corona discharge current and (b) ion concentration in unipolar mode by NTCC + and NTCC–.
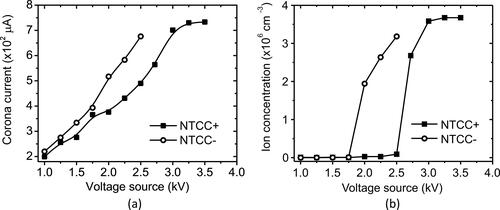
Figure 5. Mobility distribution of ions produced by the SMAC and NTCC.
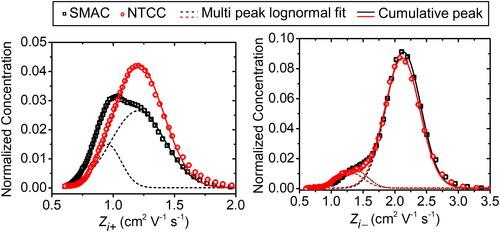
Table 1. Properties of air ions produced by the NTCC and SMAC.
Figure 6. Relative penetration of electrospray particle sizing of 214 nm with (a) diameter orifice at a carrier airflow rate of 3 L min−1 and (b) carrier airflow rate at orifice diameter of 10 mm.
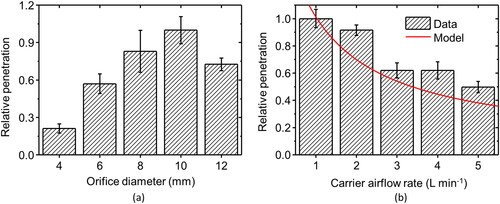
Figure 7. (a) NTCC charger performance in reducing multiply charged particles of PSL 144 nm, (b) effect of the charger in the SMPS system on multiply to singly charged ratios and (c) p-charged to the singly charged ratio when charger is in OFF and (d) ON conditions.
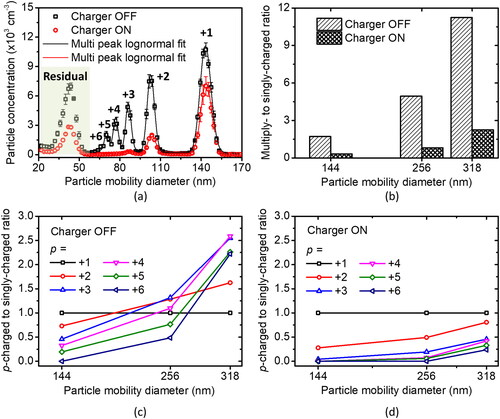
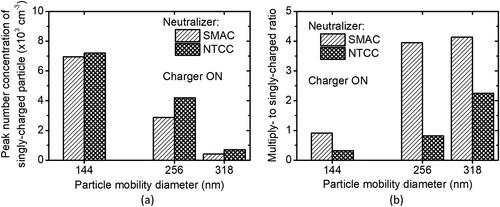
Figure 8. (a) Singly charged peak mode concentration and (b) multiply to singly charged ratio of electrospray particles produced by the EAG system with the SMAC or NTCC as neutralizers.