
Figures & data
Figure 1. A scheme of the experimental rig for visualization of the flow of glass fibers in a replica of the human trachea and the first bifurcation.
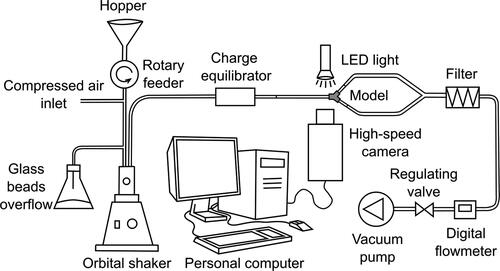
Figure 2. A visualization of the replica of the first bifurcation with indication of the measuring cross-sections.
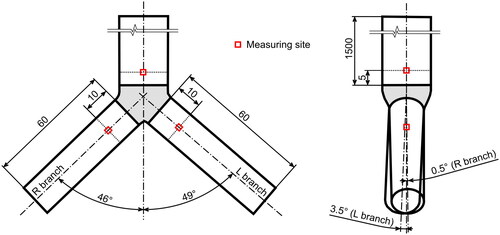
Table 1. An overview of the camera and light settings for all measured flowrates.
Table 2. Results of the measurement and statistical analysis in the center of simple straight tube, center of a tube with bifurcation and in the position 0.6R from the center of a tube with bifurcation.
Figure 3. An illustration of possible rotations of fibers parallel and perpendicular to the streamlines. Rotation (rolling) of both fibers about the main axis cannot be registered by the current system. The rotation of the parallel fiber about axes z and y could be easily recognized directly from the images, but the rotation of the perpendicular fiber about the axis x cannot be recognized from a single camera recording. Such a rotating fiber would appear shorter, but as the true length of that specific fiber is not known, no conclusions can be drawn from the observation of a single fiber. Statistical analysis was used to reveal whether the fiber lengths differed in the two observation planes, which would indicate a possible preferential rotation of the perpendicular fibers.
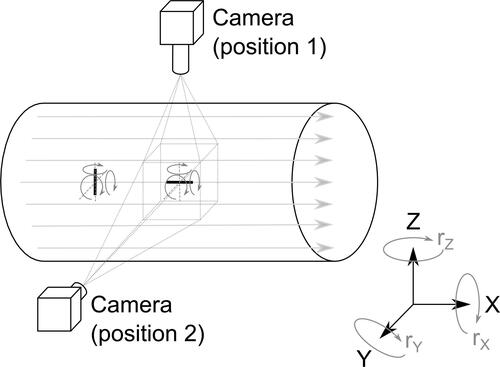
Figure 4. The ratio of parallelly and vertically oriented fibers as a function of the flow Reynolds number. The error bars represent standard deviations.
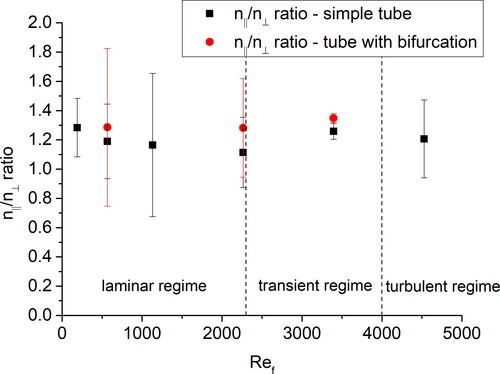
Table 3. Results of the statistical test on the prevalence of parallel fibers at the inlet and outlet of the measuring window (T2), on the difference in the fraction of parallelly oriented fibers between the inlet and outlet of the measuring window (T3), and on differences between the fractions of parallelly oriented fibers at the inlet and outlet (T4). Calculated at separated locations, flowrates and views.
Table 4. Results of the statistical test on the prevalence of parallel fibers at the inlet and outlet of the measuring window (T2), on the difference in the fraction of parallelly oriented fibers between the inlet and outlet of the measuring window (T3), and on differences between the fractions parallelly oriented fibers at the inlet and outlet (T4) – aggregated views.
Table 5. Results of the statistical test on the equality of the length of the fibers with parallel and perpendicular orientation - separated locations, and views.
Figure 5. Trajectories of fibers for Reynolds number of 3400 in the left and right main bronchus, respectively, in the coronal plane. The asterisks denote flip from perpendicular to parallel orientation, the circles the opposite flip.
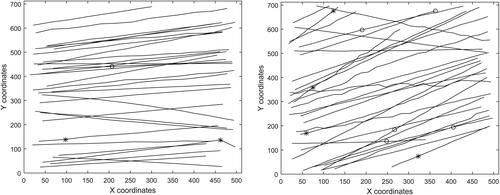
Table 6. Overview of flips observed in all measured locations and views.