Figures & data
Figure 1. The experimental schematic (a) shows aerosol generation setup and (b) shows the electrical circuit around the SDG.
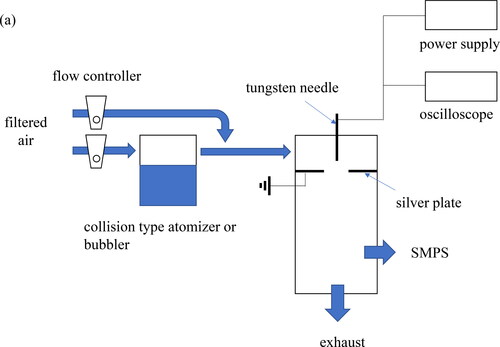
Figure 2. Size distribution of (a) the particles from SDG followed by the ethanol atomizer with different flow rates and (b) particles measured without SDG.
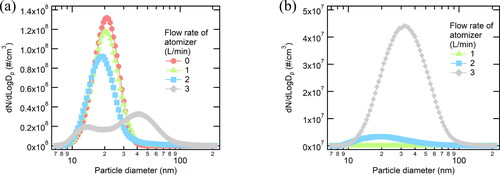
Figure 3. Size distribution of nanoparticles generated by SDG with different flowrates at the liquid bubbler; (a) ethanol, (b) methanol, and (c) water.
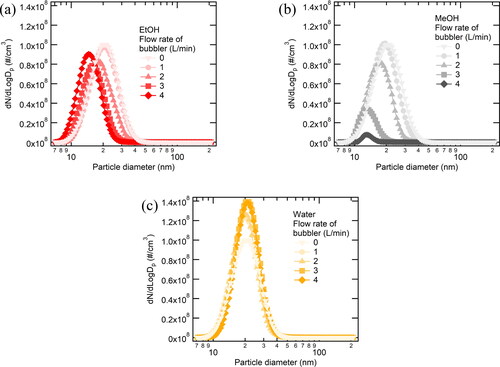
Figure 4. GMD change over gas flowrate of the atomizer and the bubbler.
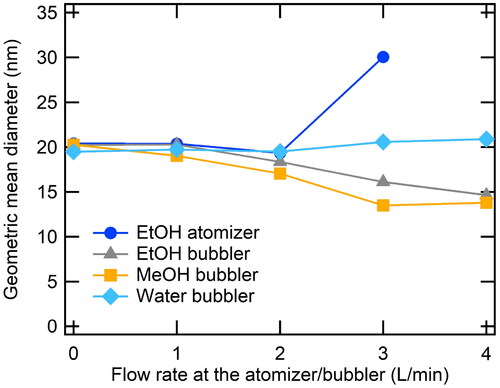
Figure 5. TEM images of particles generated (a) without an atomizer or a bubbler, (b) at 3 L/min of ethanol atomizer, (c) at 3 L/min of ethanol bubbler, (d) at 3 L/min of methanol bubbler, (e) at 3 L/min of water bubbler.
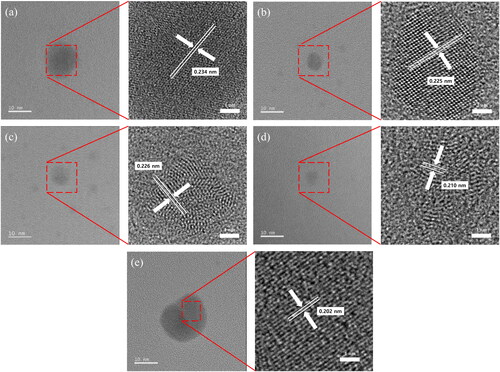
Figure 6. Discharge voltage (Vd) and frequency measured at SDG electrode using different carrier gas flowrates. (a) at EtOH atomizer, (b) at EtOH bubbler, (c) at MeOH bubbler, (d) at water bubbler. Error bars indicate standard deviations over 10 repeated measurements.
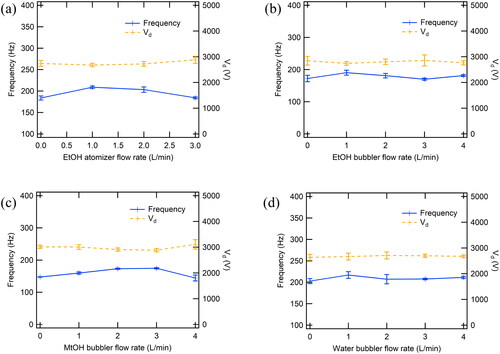
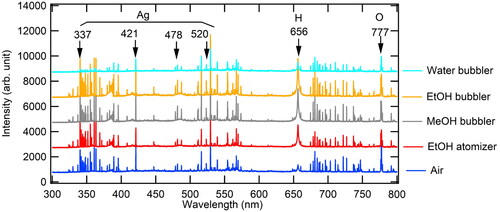
Figure 7. Emission spectra at the SDG with the volatile liquid bubbler and the atomizer.