
Figures & data
Figure 1. Variation in mask filtration efficiency with incoming particle size. (a) Diagram of capture of viral particles by a fiber within a mask. Larger particles are more easily captured because they are less mobile; smaller aerosol particles by contrast are transported around the fiber by the gas flow. Larger particles can also carry more virions, and submicron aerosol particles are unlikely to contain even a single virion (cf. text). The filtration efficiency of perfectly fitting (b) N95/FFP2 masks, (c) surgical masks, and (d) cloth masks formed from 4 identical plain-woven cotton layers are shown as a function of particle size. We show experimental measurements from Zangmeister et al. (Citation2020); Oberg and Brosseau (Citation2008) (points) and predictions from our model (lines) which does not use fitting parameters and is described elsewhere (Robinson et al. Citation2021). The shaded envelopes around the lines in (c)–(d) show the uncertainty in the model predictions, obtained by propagating uncertainties in the geometric parameters given in Zangmeister et al. (Citation2020). We set the velocity of the gas through the mask to 6.3 cm s− 1 in our calculations for comparison with data from Zangmeister et al. (Citation2020).
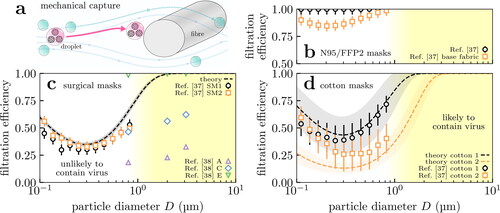
Figure 2. Fabrics are broadly categorized as knitted (not shown), woven or non-woven. (a) Woven fabrics formed by intersecting perpendicular yarns (the “warp” and “weft”). (b) Nonwoven fabrics are formed by entangling fibers through other means, resulting in less ordered arrangements. Scanning electron microscope images of example fabrics show scalebars of (a) 100 µm and (b) 50 µm.
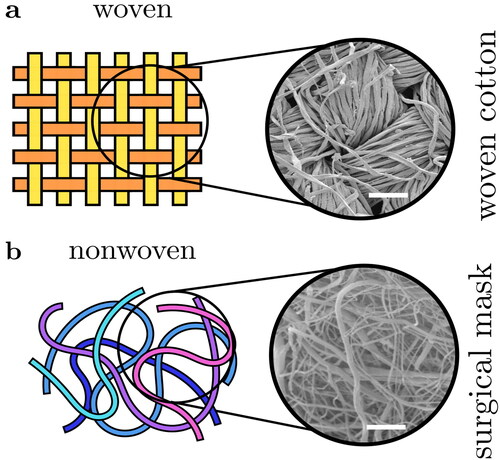
Figure 3. Aerosol distributions relevant to masking: respiratory aerosols and the test aerosol used in FFP2 standards testing. We show the theoretical filtration profile of the surgical mask in for reference. Aerosol particles are coarser on exhalation (solid) than inhalation (dashed) because of evaporation, and so the exhaled size distribution overlaps more strongly with the region where masks filter effectively (dotted line and blue shaded region). The test aerosol (dash-dotted) contains primarily finer particles than are generally found in respiratory aerosols.
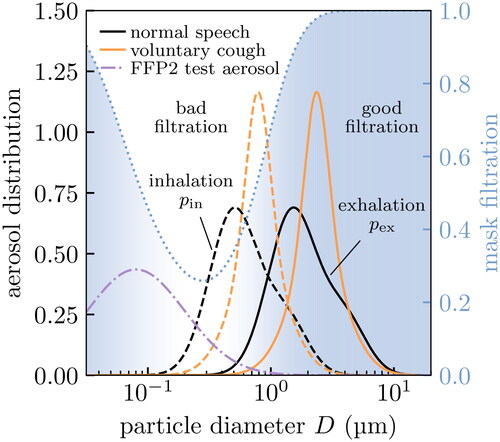
Table 1. Expected efficacy of perfectly fitting surgical masks at removing aerosol particles with various size distributions. We assume the theoretical filtration profile for the surgical masks shown in . In practice, mask leakage would reduce the fraction removed. These numbers are expected to be similar for (perfectly fitting) multi-layered cloth masks (cf. ).
Figure 4. Histograms of key properties of expiratory particles, i.e., normalized so that the area under the curves gives the relative frequency. (a) Distributions of SARS-CoV-2 viral loads in testing from RT-PCR in two studies (Jones et al. Citation2021b; Jacot et al. Citation2020) (points) and our bimodal fits for calculating percentiles (lines). Note the large distribution, and the presence of a tail of patients with extraordinarily large viral loads (shaded purple) corresponding to so-called “superreplicators”. (b)–(c) Aerosol distributions for virus-laden particles exhaled during speech and voluntary coughing under viral loads typical of the top 25th percentile in (a). We show the distributions of inhaled aerosols that contain at least one virus (solid lines) and those that bypass a perfectly fitting surgical mask worn by the inhaler (dashed lines); the latter are unnormalized to show the effect of filtering. We calculate the former distributions using data from Gregson et al. (Citation2021); Johnson et al. (Citation2011) to characterize the exhaled aerosol particles in healthy patients.
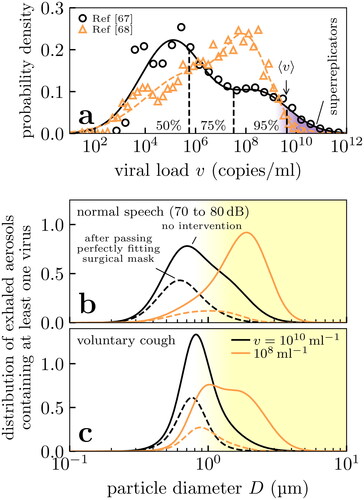
Figure 5. Effect of deposition on the size distribution of aerosol particles received in the respiratory tract of the inhaler. Fine aerosol particles with diameters ∼0.1 to 1 µm are unlikely to deposit in the respiratory tract, shifting the effective aerosol particle size distribution of concern to coarser particles. (a) Probability of deposition at various sites in the respiratory tract, showing experimental data (points) from Chalvatzaki et al. (Citation2020) and our quadratic interpolation (lines). (b) Probability density for inhaled bioaerosol particles from Gregson et al. (Citation2021); Johnson et al. (Citation2011) (solid lines), and the probability density of those aerosol particles which actually deposit in the respiratory tract (dashed lines) after conditioning on data in (a).
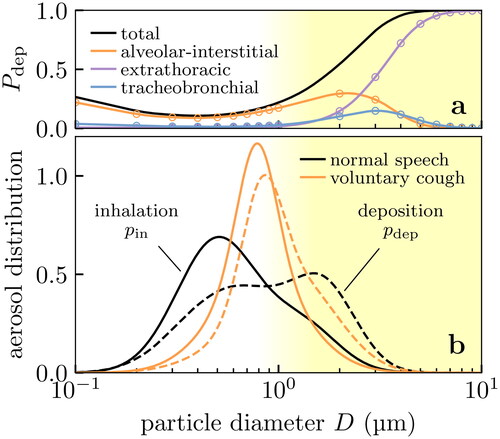
Figure 6. Number fraction of viral aerosol particles (i.e., those containing at least one virus) from an infected exhaler that are prevented from being deposited into the respiratory tract of the inhaler, considered where (a) only the inhaler is masked, (b) only the exhaler is masked and (c) both are masked. The upper limits at small viral loads correspond to the mass fraction (i.e., the depositing viral dose) removed. In all three scenarios the effect of constant mask leakage is examined, and we assume: (i) a surgical mask with the theoretical filtration profile of , (ii) the bioaerosol particle size distributions shown in , and (iii) the deposition probabilities of . Biological variation affects the practical mask effectiveness, but the effect of mask leakage predominates.
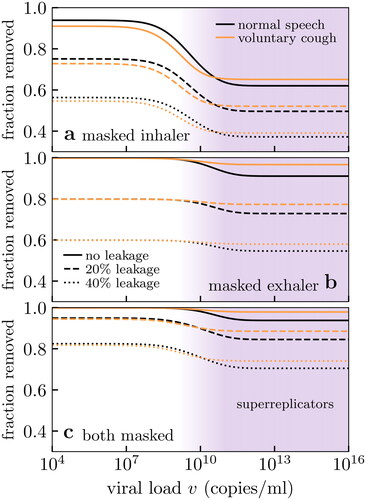
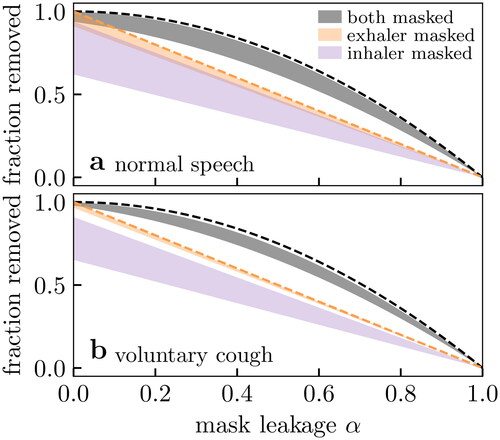
Figure 7. Effect of mask leakage on (number) fraction of vector aerosol particles (see text and ) removed for two exhalation modes. The filled envelopes indicate the range of expected values from varying viral load as in . The upper limits are equivalent to the mass fraction (i.e., depositing viral dose) removed. We show the expected performance for perfect filtration media (dashed lines) for two masks (black) and one mask (orange). We assume: (i) a surgical mask with the theoretical filtration profile of , (ii) the bioaerosol particle size distributions shown in , and (iii) the deposition probabilities of .
Data availability statement
The data presented as results in this study were obtained using a computer code which implements the methods outlined in the text. This code is freely available at Robinson and Sear (Citation2021).