Figures & data
Figure 1. Velocity contours in x/De = 1 plane from (a) realistic geometry and (b) canonical rectangular slot with tabs (figure re-created based on Zaman Citation1996).
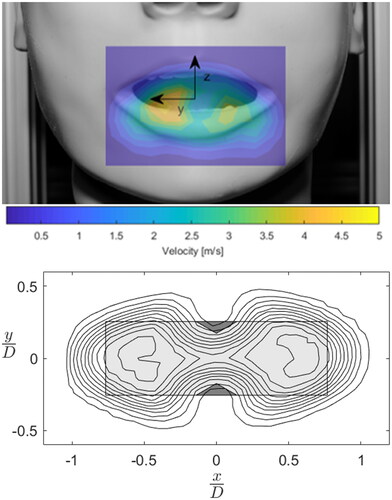
Figure 2. (a) Snapshot of particle release during cough with contours of average velocity in the y = 0 plane superimposed. (b) Average velocity contours in y = 0 plane with angle of cough boundaries indicated. The boundary is defined by points at which the velocity is below 0.5 m/s, or less than 10% of the maximum jet velocity of 5 m/s.
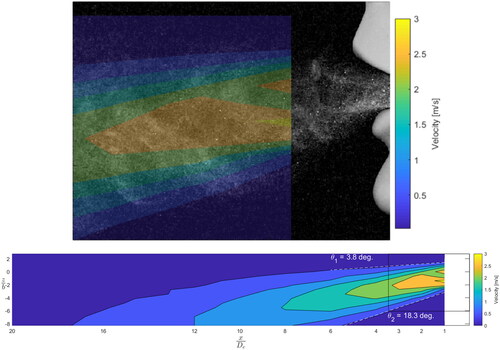
Table 1. Particle load (mass per size class) used for each experiment. The particles nominally had density of water ( saliva), ρ =1 ± 0.01 g/cm3.
Figure 3. Downstream velocity profiles along z/b = −1 plane.
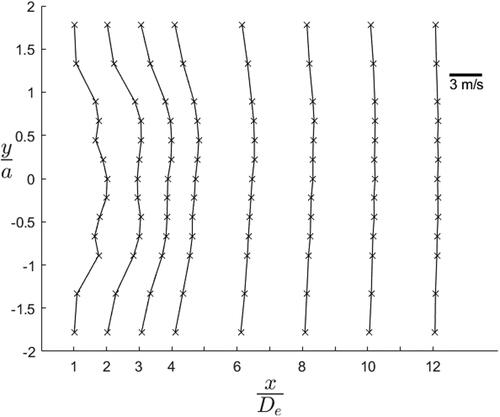
Figure 4. Modified Stokes number, St*, along the horizontal z/b = −1 plane and centerline particle concentration, with standard deviation due to test-to-test variation given by shaded error bars.
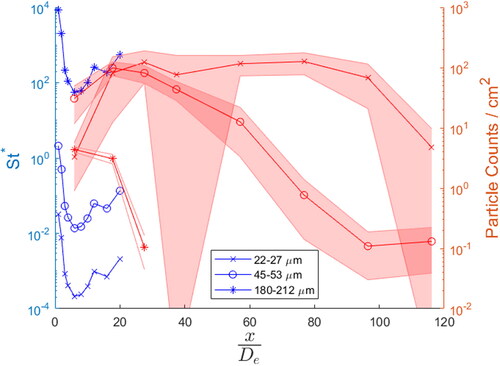
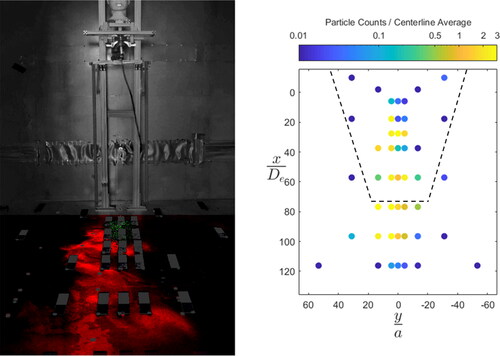
Figure 5. Comparison of (a) false color image of 22–27 μm (red) and 180–212 μm (green) particle deposition with (b) measured 22–27 μm particle deposition during a single experiment with image view indicated by dashed line.