
Figures & data
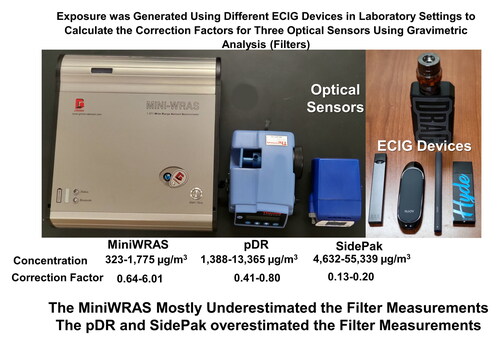
Table 1. Settings for different E-CIG devices.
Figure 1. Experimental setup used to measure E-CIG exposure of Different Vaping Devices.
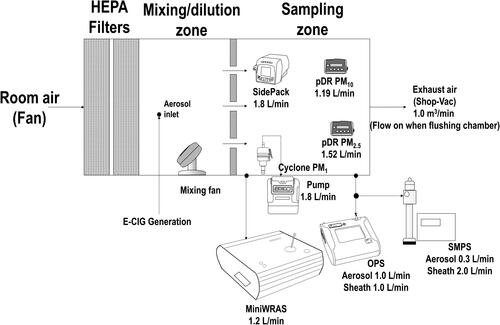
Table 2. Correction factors for instruments of each particle size and ECIG device. The average and standard deviation were computed based on three experiments.
Figure 2. Size-selective Box-Whisker plots for (a) MiniWRAS, (b) pDR, and (c) SidePak. The MiniWRAS measures PM1, PM2.5, and PM10, whereas two pDRs were used, one for PM2.5 and the other for PM10 measurements, and the SidePak only measured PM2.5. The measurements represent non-filter-corrected raw data.
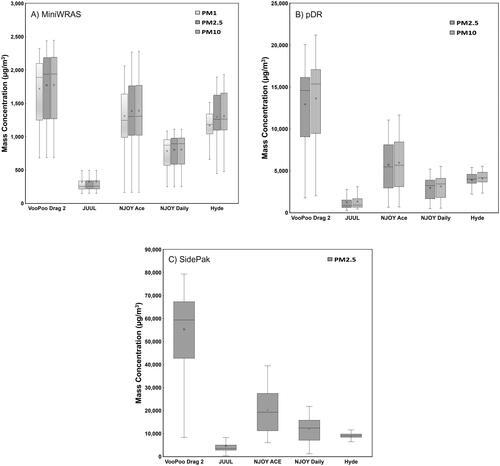
Figure 3. Aerosol size distribution by mass for the (a) SMPS + OPS fitted data and (b) MiniWRAS for the different ECIG devices. The x-axis represents the volumetric particle diameter. Each curve's average and standard deviation were computed based on three measurements. The y-axis represents the standard deviation of the three measurements.
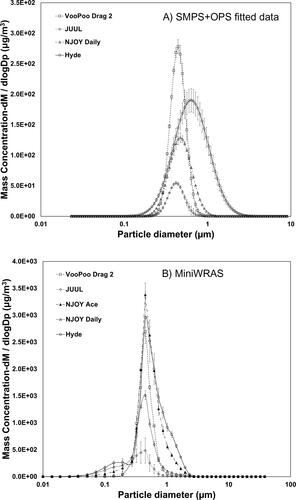
Table 3. The MMD and GSD for each E-CIG device based on the SMPS, OPS, and SMPS + OPS fitted data. The average and standard deviation (between brackets) were computed based on three measurements.
Supplemental Material
Download MS Word (17.2 KB)Data availability statement
The datasets generated from the current study are available from the corresponding author on reasonable request.