
Figures & data
Figure 1. (a) Example number-weighted (left axis, blue) and volume weighted (right axis, gold) particle size distributions measured with the APS and shown for averages during the fill period with active particle production (solid line) period, near the end of the natural decay period (dashed line), and near the end of the active air filtration period (dotted line) for the home office. Number-weighted distributions are normalized to a diameter of 1.2 microns and volume weighted to 2.8 microns, corresponding to the number-weighted and volume-weighted median diameters, respectively. (b) Example results for one experiment in the home office showing the number-weighted median diameter (black solid line) and the particle number concentration (blue dashed line) across the fill period, natural decay period, and active air filtration period.
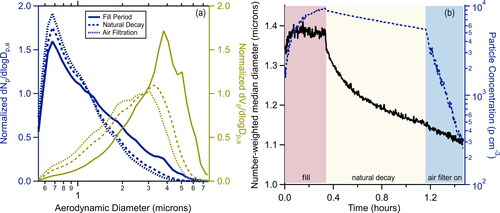
Figure 2. Example particle number decays measured in the home office for the natural ventilation + particle deposition (at t < 0) and with the filter-based air cleaners on (t > 0) shown on a (a) log scale and (b) linear scale. Particle concentrations have been normalized to unity at t = 0.
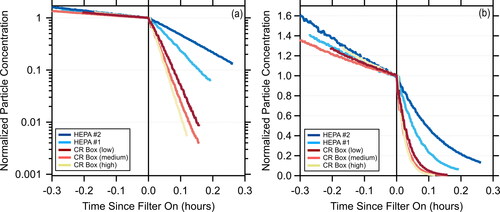
Figure 3. (left axis) The number-weighted clean air delivery rate for the various filter-based air cleaners (left axis, bars) as measured in the home office (left hash marks) and classroom (right hash marks). (right axis) The price normalized CADR (black circles), sound level (dark gray triangles), and power (light gray squares).
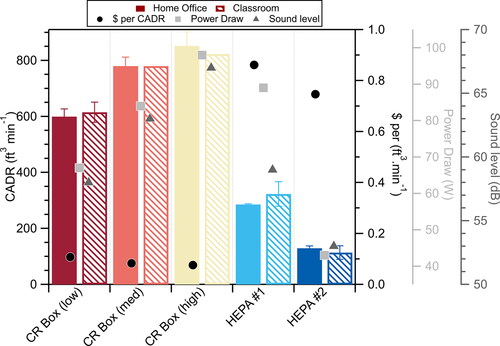
Table 1. Measured equivalent air changes per hour and clean air delivery rates.
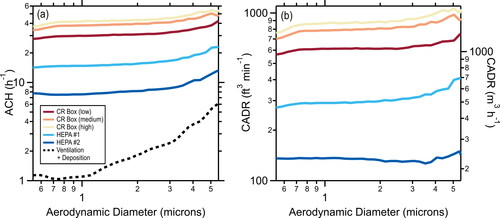
Figure 4. (a) Size-dependent equivalent air changes per hour with the various filter-based air cleaners operating (solid lines) and for the natural room ventilation + particle deposition alone (dashed line), as measured in the home office. (b) The corresponding clean air delivery rates for the various filter-based air cleaners. Results for the classroom are similar (not shown).
Supplemental Material
Download PDF (1.2 MB)Data and materials availability
All data needed to evaluate the conclusions in the article are present in the article and/or the supplementary materials.