Figures & data
Table 1. Summary of dust and biological samples.
Figure 1. Distribution of relative ion signals for (a) 26CN−, (b) 42CNO−, (c) 79PO3− from a variety of soil and mineral dust samples. Warmer colors indicate higher relative intensities. The ATD sample was analyzed with a different ATOFMS than the other samples, and thus the relative ion distributions are not directly comparable.
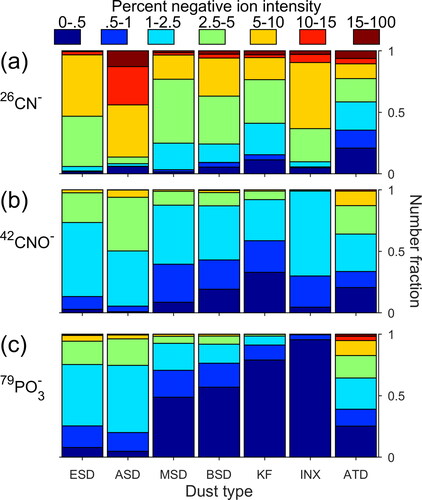
Figure 2. (a) Individual mass spectra for all cellular standards (red) and dust standards (black) plotted in 79PO3−/63PO2− versus 26CN−/42CNO− space. The blue box in the inset highlights a region of high overlap between the two particle types. Individual (b) ASD and (c) Ps mass spectra in 79PO3−/63PO2− versus 26CN−/42CNO− space. (d) Individual mass spectra for all Cell-type (red) and Dust-CW (black) particles plotted in 79PO3−/63PO2− versus 26CN−/42CNO− space. The red box in the inset highlights a region of high overlap between the two particle types. Individual (e) Dust-CW and (f) Cell-type mass spectra in 79PO3−/63PO2− versus 26CN−/42CNO− space. Warmer shades indicate higher total positive ion intensities.
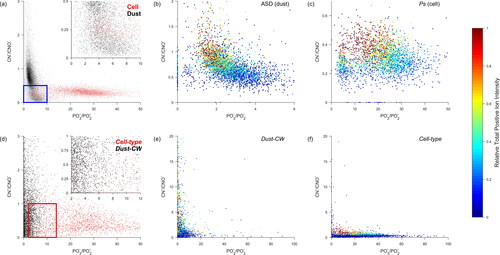
Figure 3. Representative mass spectra for ASD (dust) with relatively low (a) and high (b) TPII. Representative mass spectra for Ps (cellular) with relatively low (c) and high (d) TPII.
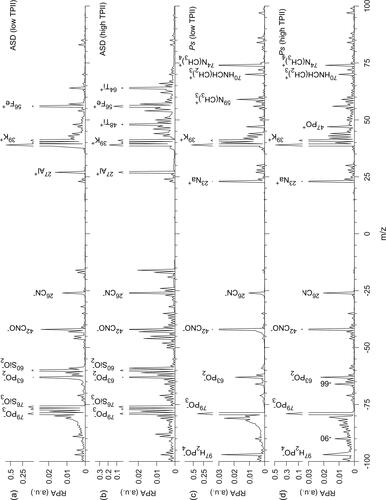
Figure 4. For each dust sample analyzed, number fraction of mass spectra with relative ion signals for (a) 39K+ > 0.25, (b) 23Na+ > 0.01, (c) 27Al+ > 0.05, (d) and 48Ti+,64TiO+ > 0.05.
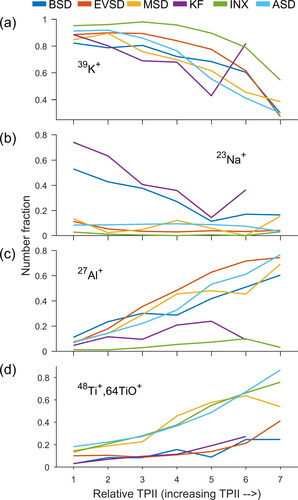
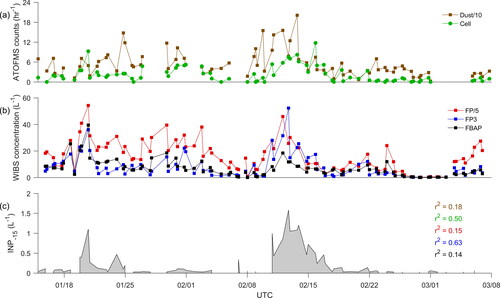
Figure 5. Temporal profiles of (a) ATOFMS hourly counts for Dust (divided by 10, brown) and Cell-type (green), (b) WIBS concentrations for FP (red, scaled by 1/5), FP3 (blue), and FBAP (black), and (c) INP-15 (L−1). Correlation coefficients (r2) between INP-15 and WIBS or ATOFMS particle types are shown in their respective colors.