Figures & data
Table 1. Boundary conditions for KAUST and RWTH sets of C2H4 counterflow flames.
Figure 1. Experimental peak SVF as function of strain rate for the sets of flames analyzed in this study (KAUST (Wang and Chung Citation2016) and RWTH (Kruse et al. Citation2019)) and for similar flames available in literature (WUT-KAUST (Xu et al. Citation2018) and WUT (Yan et al. Citation2019a)).
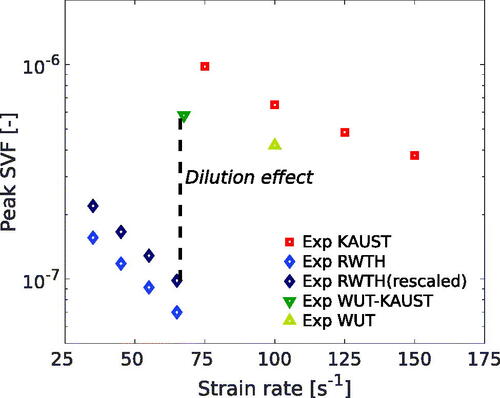
Figure 2. Computed values of γ with D’Alessio et al. (Citation2005) () and Raj et al. (Citation2010) (
) formulations versus experimental data (Chung and Violi Citation2011) for different precursors.
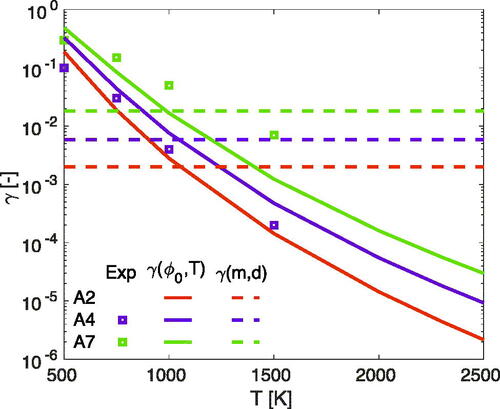
Figure 3. Computed temperature and A2R5 profiles for (a) KAUST and (b) RWTH flames.
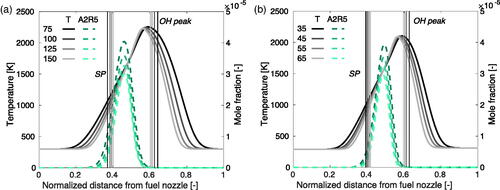
Table 2. Information on the nucleation models features used in the sensitivity analysis.
Figure 4. Normalized SVF as function of strain rate (a), SVF profiles along spatial coordinate (b) and PAHs sensitivities to strain rate (c) for KAUST flames with RM1, RM2 and experimental/numerical results from Wang and Chung (Citation2016).
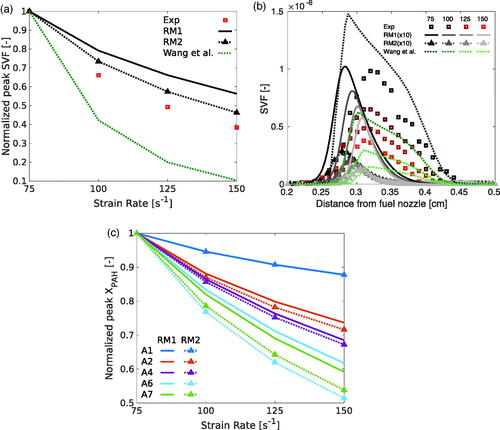
Figure 5. Normalized maximum values of pseudo-PAH and dimer concentrations along with dimerization rate, nucleation and condensation collision rate constants for RM1 (a); nucleation and condensation production rates contributing to total soot volume for RM1 (b).
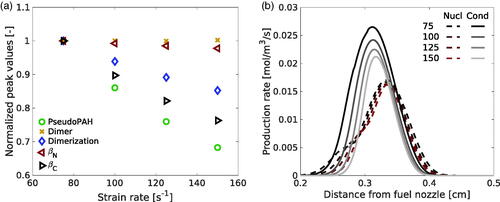
Figure 6. Normalized SVF as a function of strain rate (a) and SVF profiles along spatial coordinate (b) for KAUST flames with RM1, RM3 and experimental data from Wang and Chung (Citation2016).
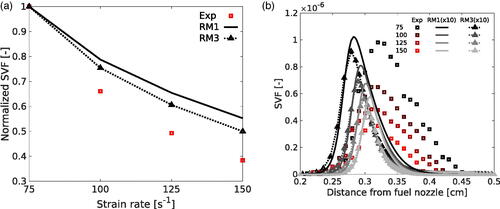
Figure 7. Normalized SVF as function of strain rate (a), SVF profiles along spatial coordinate (b), PAHs sensitivities to strain rate (c) and PAHs consumption rate along spatial coordinate (d) for KAUST flames with RM1, RM4 and experimental data from Wang and Chung (Citation2016).
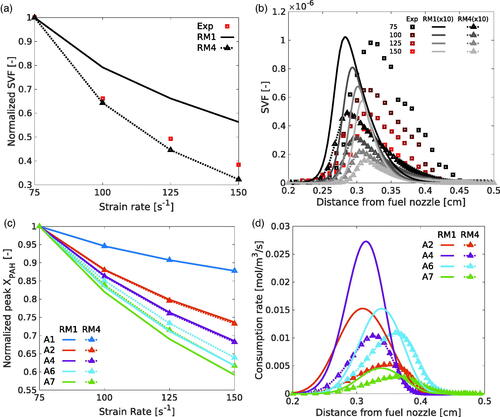
Figure 8. Normalized peak values of pseudo-PAH and dimer concentrations along with dimerization rate, nucleation and condensation collision rate constants for RM4 (a); nucleation and condensation production rates contributing to total soot volume for RM4 (b).
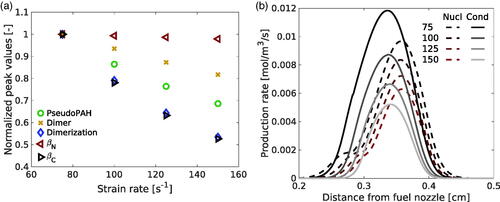
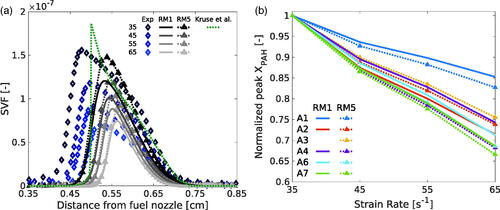
Figure 9. SVF profiles along spatial coordinate (a) and PAHs sensitivities to strain rate (b) for RWTH flames with RM1, RM4 and experimental data from Kruse et al. (Citation2019).
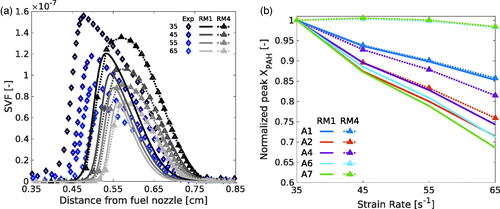
Figure 10. Experimental and computational normalized peak SVF for KAUST and RWTH flames with RM1.
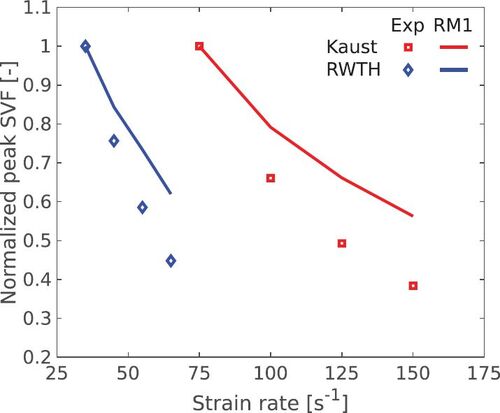
Figure 11. SVF profiles along spatial coordinate (a) and PAHs sensitivities to strain rate (b) for RWTH flames with RM1, RM5 and experimental/computational results from Kruse et al. (Citation2019).