Figures & data
Figure 1. Schematic illustration of the experimental set-up. For tests with ambient air the CCN-VACES inlet was open. For tests with nebulized sea water the set-up in the dashed square was coupled to the inlet.
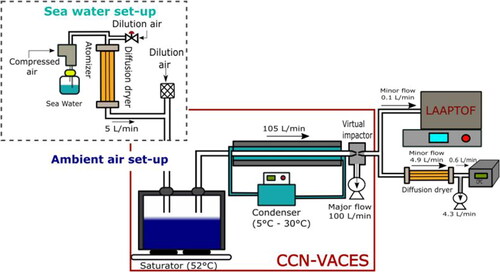
Figure 2. LAAPTOF size distribution obtained for ambient aerosol (left panel) and of droplets originating from activated CCN (0.6% supersaturation) right panel; both for ambient aerosol, 29.04.2019.
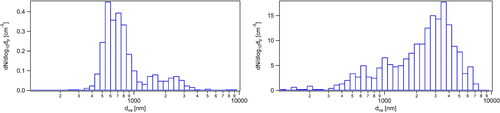
Figure 3. Central spectrum corresponding to class 1 or “internally mixed.”
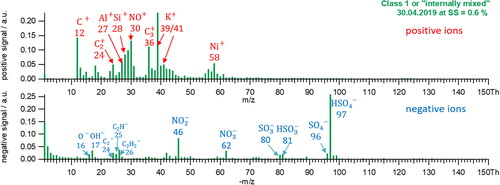
Figure 4. Central spectrum corresponding to class 2 or “carbon and nitrate.”
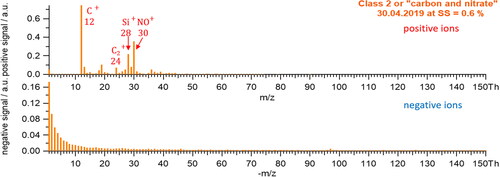
Figure 5. Central spectrum corresponding to class 3 or “carbonaceous rich.”
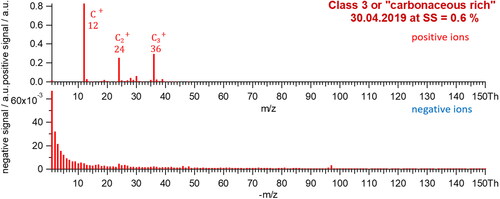
Figure 6. Central spectrum corresponding to class 4 or “nitrate rich.”
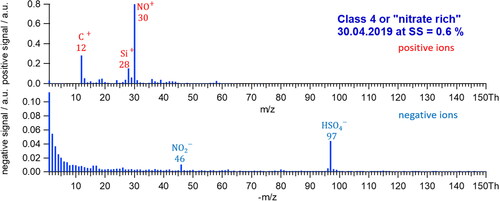
Figure 7. (a) Activated CCN attributed to class 2 “carbon and nitrate,” (b) activated CCN attributed to class 3 or “carbonaceous rich,” (c) activated CCN attributed to class 4 or “nitrate rich.”
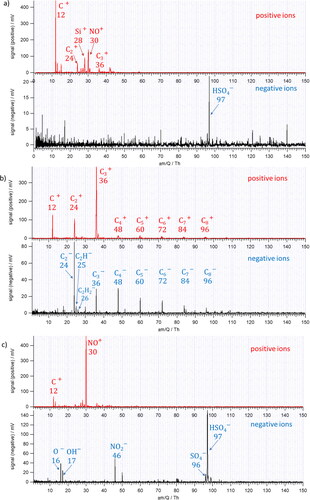
Figure 8. (a)–(c): Activated CCN attributed to class 1 or “internally mixed.”
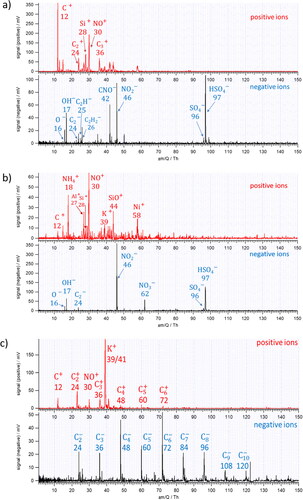
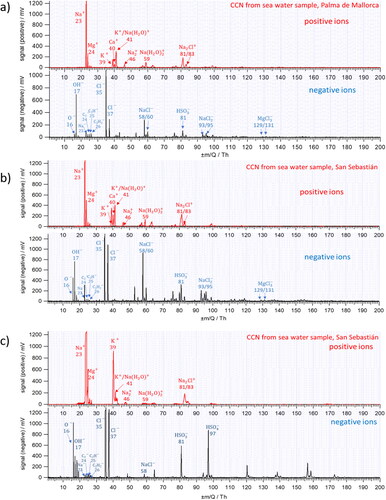
Figure 9. (a) Activated CCN (0.6% supersaturation), sea water sample Palma de Mallorca, (b)–(c) activated CCN (0.6% supersaturation), sea water sample San Sebastián.