
Figures & data
Figure 1. Schematic of experimental set-up with spray combustion (not to scale) enclosed in two 30 cm long quartz glass tubes with 20 L/min of nitrogen added between the tubes with a torus ring (Teleki et al. Citation2009). Particles are sampled (Goudeli, Gröhn, and Pratsinis Citation2016) after the second glass tube and diluted with nitrogen. Most of the flow is then sent through a glass fiber filter for offline N2 adsorption analysis, thermogravimetric analysis (TGA) and transmission electron microscopy (TEM) of the collected soot. The remaining flow is further diluted with a rotating disk dilution system and sent through an X-ray neutralizer followed by a differential mobility analyzer (DMA) and condensation particle counter (CPC), which typically make up a scanning mobility particle sizer (SMPS). Broken lines represent tubing which was added only temporarily for tandem aerosol particle mass (APM) APM–SMPS measurements.
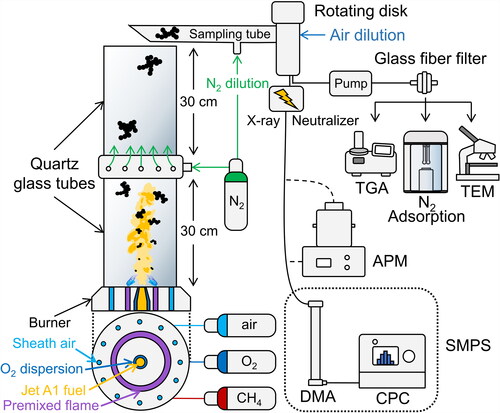
Figure 2. Normalized soot number concentration, dN/dlog(dm)/Ntot, as a function of mobility diameter, dm, at various equivalence ratios (EQR). The shaded areas represent one standard deviation between, at least, 9 measurements.
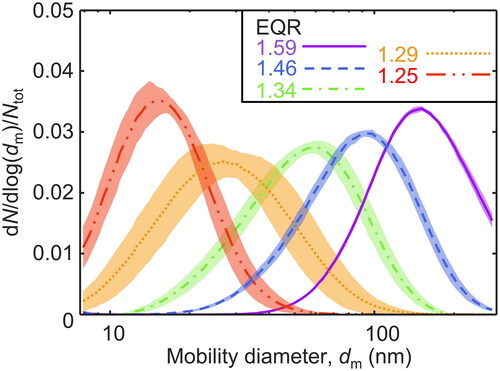
Figure 3. (a) The geometric mean mobility, (open circles), and PP diameter,
(open triangles), as well as (b) the geometric standard deviation of the mobility, σg,m (filled circles), and PP size distributions, σg,p (filled triangles), as a function of EQR. Error bars represent the standard deviation between, at least, 9 measurements.
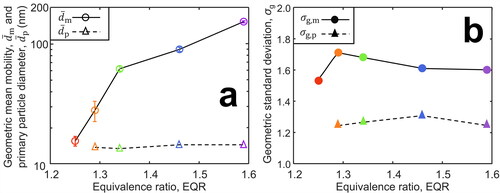
Figure 4. The number of soot PPs per agglomerate, np, as a function of their normalized mobility diameter, dm/ produced at various EQR and measured by APM-SMPS (symbols and double dot-broken line). Power laws derived for aggregates (Kelesidis, Goudeli, and Pratsinis Citation2017b; solid line) and agglomerates of monodisperse PPs in point contact (Sorensen Citation2011; dotted line) or aggregates of polydisperse and chemically bonded PPs (Kelesidis, Goudeli, and Pratsinis Citation2017a; dot-broken line) are shown also. The inset shows an exemplary TEM image of soot made at EQR = 1.29.
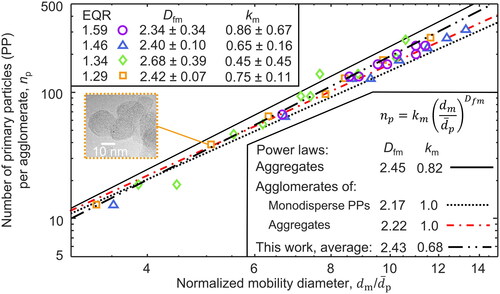
Figure 5. Effective density, ρeff, as a function of dm of soot from enclosed spray combustion at EQR = 1.59 (circles), 1.46 (triangles), 1.34 (diamonds) and 1.29 (squares) in comparison to data from an airplane (Johnson et al. Citation2015; open inverse triangles) and a helicopter engine (Olfert et al. Citation2017; filled inverse triangles). The measured soot ρeff are compared also to those obtained from a power law derived by DEM for surface growth and agglomeration (Kelesidis, Goudeli, and Pratsinis Citation2017b; red dot-broken line and red shaded area), as well as an empirical power law extracted from engine data (Olfert and Rogak Citation2019; black solid line and gray shaded area).
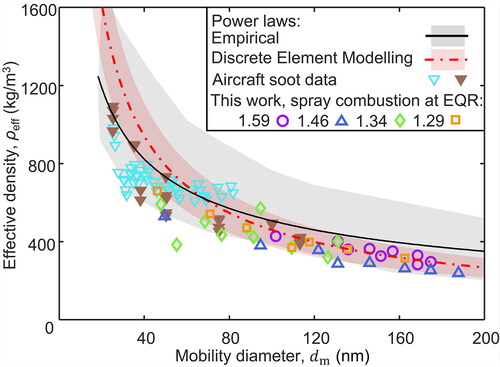
Figure 6. The present OC/TC of soot from TGA (open symbols) and TOA (filled symbols) as a function of EQR.
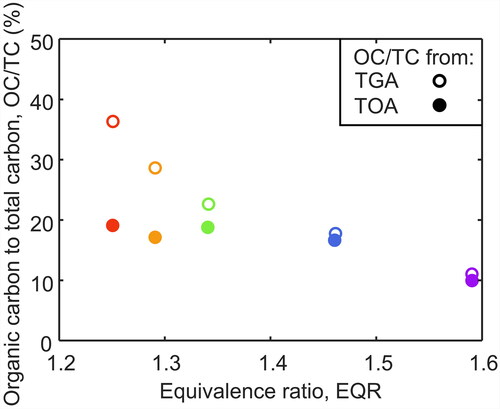
Table 1. The OC/TC of soot from various aircraft engines, as well as from enclosed spray combustion at EQR = 1.25 – 1.34 measured by TOA and/or TGA.
Figure 7. The mass concentration, M, of soot produced from enclosed (circles) and open spray combustion units (Kholghy and DeRosa Citation2021; squares) as a function of as well as a 5201 miniCAST (Ess and Vasilatou Citation2019; triangles) with its data corrected with a realistic MAC.
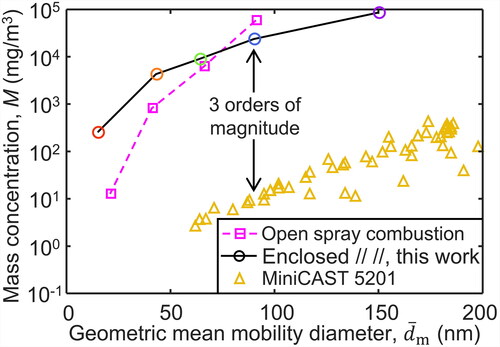
Figure 8. Specific pore surface area concentration, dA/dlog(w), as a function of pore width, w, of soot made at EQR = 1.59 (solid line), 1.46 (broken line), 1.34 (dot-broken line) and 1.29 (dotted line) using the Barrett-Joyner-Halenda (BJH) method.
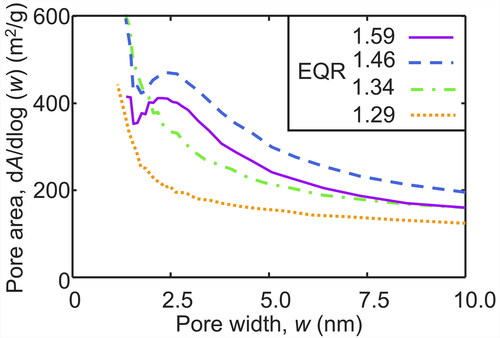
Table 2. The specific surface area spray combustion soot at four EQR by the N2 adsorption, SSA, and with transmission electron microscopy (TEM), SSATEM. The from the literature is used to estimate the SSATEM of aircraft soot from
= 10 (Boies et al. Citation2015) to 18 nm (Liati et al. Citation2014).