Figures & data
Figure 1. Schematic diagram of the surface cleaning prototype utilizing air jets with vacuuming combined with ultrasonication.
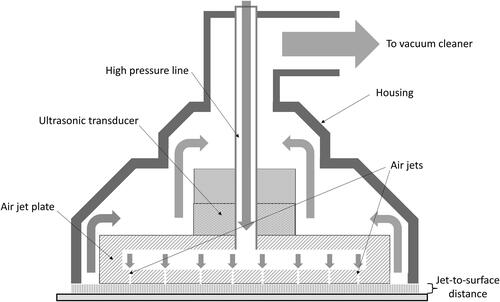
Figure 2. The particle removal efficiency provided by the prototype utilizing air jets with vacuuming tested with six surface materials using aluminum particles and gravimetric method. The particle removal efficiency values obtained under the same conditions with the 500-rpm rotating brush are also plotted for comparison. The error bars represent arithmetical standard deviation.
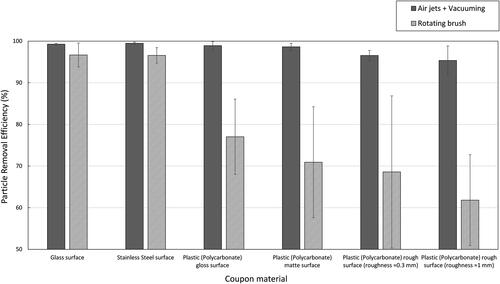
Figure 3. The particle removal efficiency of the prototype utilizing air jets with vacuuming tested with four selected surface materials using PSL particles of three sizes and the fluorescence microscopy method. The error bars represent arithmetical standard deviations.
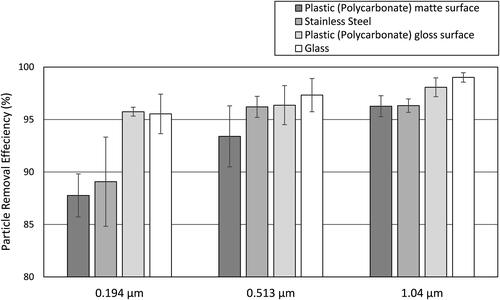
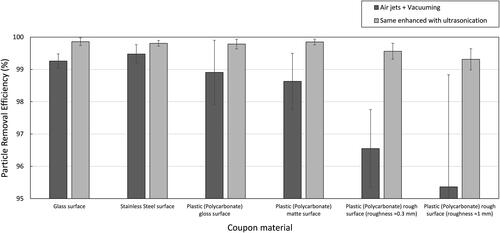
Figure 4. The particle removal efficiency provided by the prototype utilizing air jets with vacuuming combined with ultrasonication tested with six surface materials using aluminum particles and gravimetric method. The particle removal efficiency values obtained under the same conditions with the air-jet techniques without ultrasonication are also plotted for comparison. The error bars represent arithmetical standard deviations.