Figures & data
Figure 1. Experimental setup for determining the sintering kinetics: (a) the particle synthesis, which provides defined particle structures, (b) the model flow reactor (MFR) to induce structure formation of aerosol particles under well-defined conditions, and c) characterization of the particles with online and offline instrumentation.
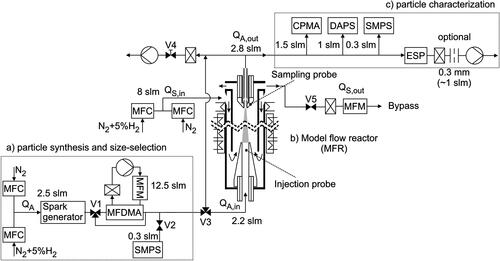
Figure 2. (a) Mean temperature-time history and (b) residence time distribution
for a number of trajectories
at three different furnace temperatures. Solid lines indicate the mean calculated from CFD simulation for furnace temperatures of 773 K, 1023 K, and 1273 K. The standard deviation of
in (a) is shown as gray area.
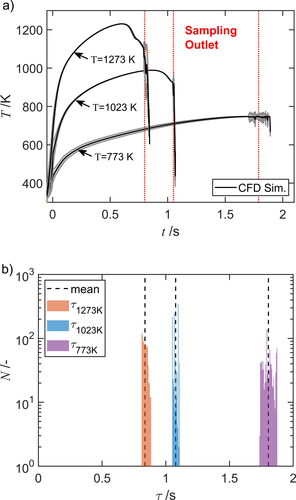
Figure 3. Rietveld refinement of Cu-K XRD data of a powder sampled from the spark generator housing after several hours of synthesis in pure nitrogen. Diffractograms for the separate phases magnetite Fe3O4 (27 wt.%), iron-deficient magnetite Fe3O4* (41 wt.%), hematite Fe2O3 (31 wt.%), and iron Fe (1 wt.%) as refined together with original data, total refined profile (fit) and residual (difference between data and refinement) are displayed.
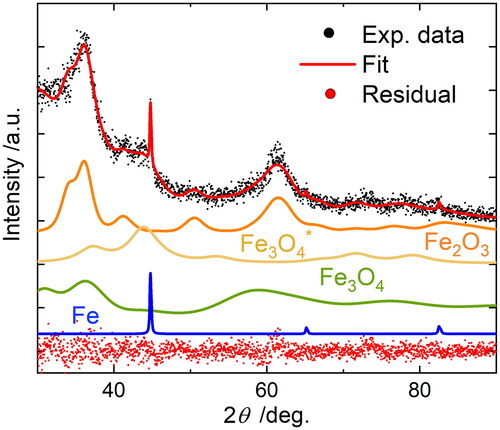
Figure 4. LCF fitting of the Fe-K edge XANES spectra of polydisperse FexOy nanoparticles after sintering at 1373 K (black line) in purified nitrogen (N2) (a) and reducing gas mixture of nitrogen and hydrogen (95 vol% N2+5 vol% H2) (b) with corresponding Fe and Fe3O4 references.
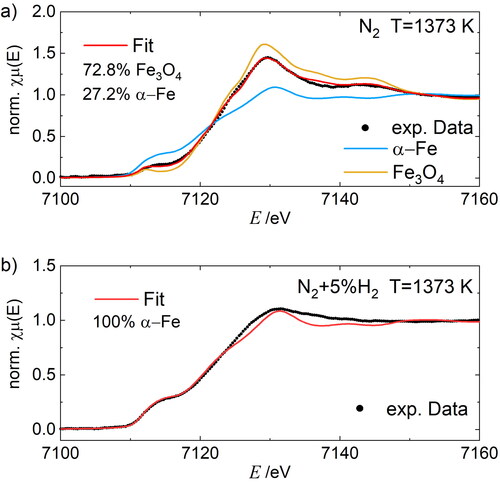
Figure 5. Electron energy loss spectra (EELS) of spherical FexOy nanoparticles after sintering at 1373 K with a diameter of 20 nm and 60 nm (a) in purified nitrogen and (b) in 5 vol% hydrogen.
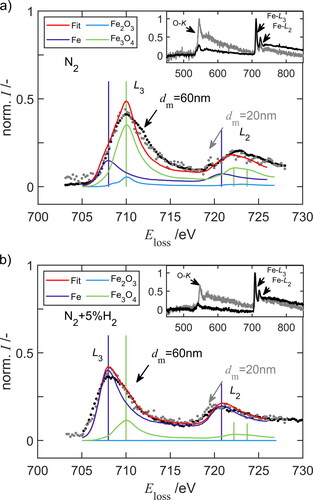
Figure 6. (a) and (c) Effective density and (b) and (d) primary particle diameter
as function of the mobility diameter
for different furnace temperatures in (a) and (b) N2 and (c) and (d) in N2+5%H2.
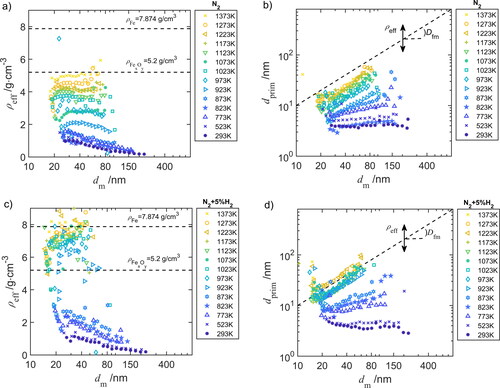
Figure 7. Morphology change due to sintering according to the experimental data (symbols, connected by dashed lines) and results of the sintering model using the best fitting combination of and
assuming
=1 (solid lines). Shown are the primary particle diameter
(circles) and number of primary particles per agglomerate
(crosses) of different sized agglomerates as function the furnace temperature-time histories in (a) pure nitrogen (N2) and (b) in nitrogen with 5 vol% hydrogen (N2+5%H2).
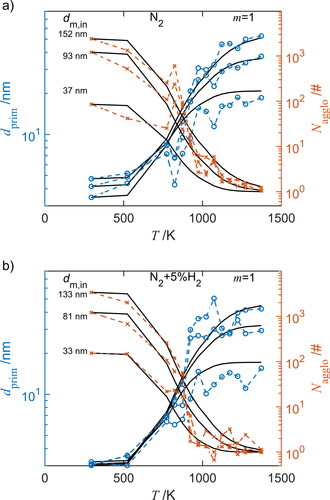
Table 1. Sintering parameters and
determined using error minimization of the residuals sum of squares (
), for three different gas atmospheres and four sintering exponents
.
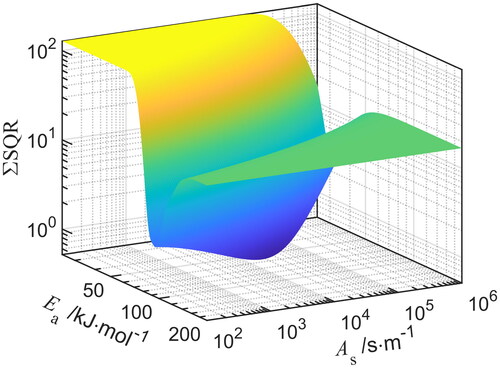
Figure 8. Numerical solution as sum of quadratic errors () as function of the activation energy
and the pre-exponential rate
of iron oxide in N2, assuming
=1. The global minimum is numerically calculated by the deviation to experimental primary particles.