Figures & data
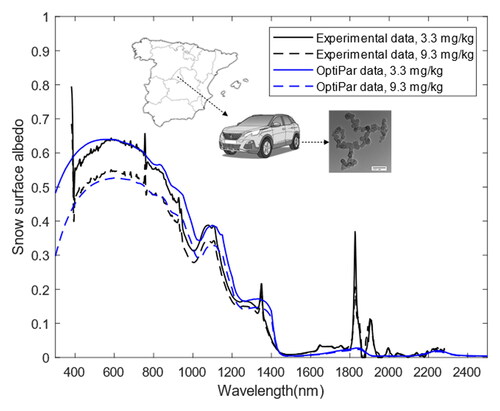
Figure 1. Installation of the spectroradiometric system.
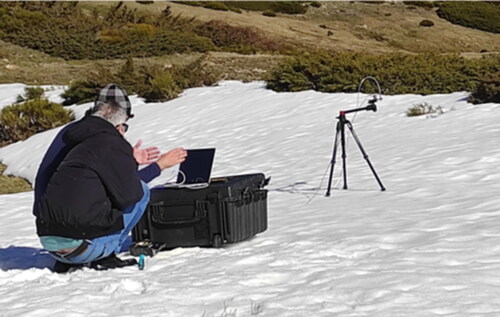
Figure 2. Spectral albedo corresponding to 11.10 h solar time prior (left) and after smoothing (right).
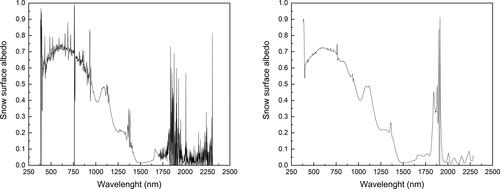
Figure 3. Flowchart of OptiPar software.
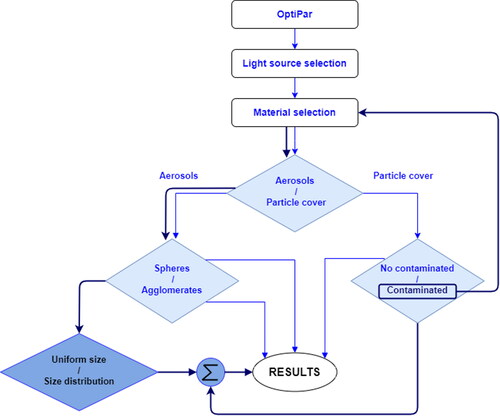
Figure 4. Flowchart of the experimental-modeling methodology.
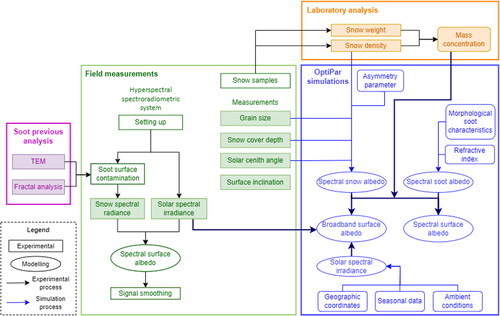
Figure 5. Loaded filter before (3.3 mg/kg of insoluble material) (left) and after additional contamination of the snow with external soot (9.3 mg/kg of insoluble material) (right).
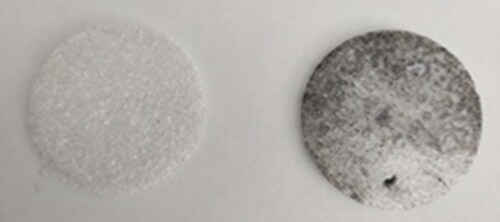
Figure 6. Irradiance (left) and radiance (right) spectra registered from 10:40 to 13:30 solar time, every 10 min (represented with different colors).
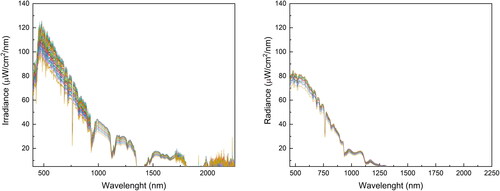
Figure 7. Broadband snow albedo and corrected zenith angle evolution on the local solar time.
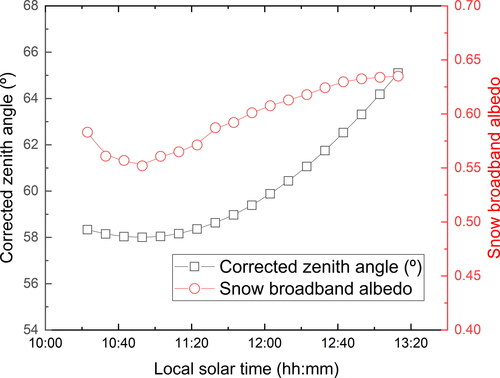
Figure 8. Example of agglomerate with morphological characteristics close to the average ones (fractal dimension = 1.84, number of primary particles = 84).
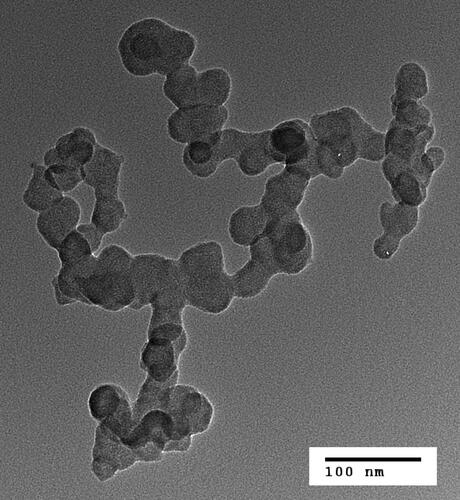
Figure 9. Experimental and OptiPar modeled albedo results for snow surface contaminated with 3.3 and 9.3 mg/kg soot.
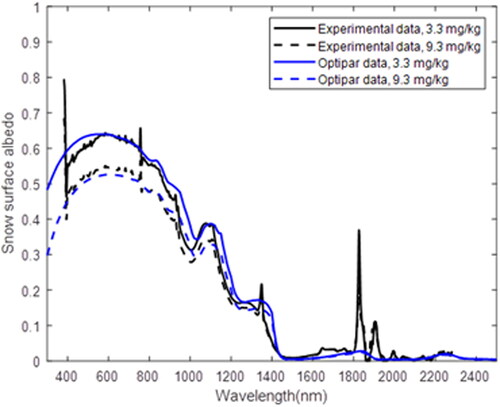
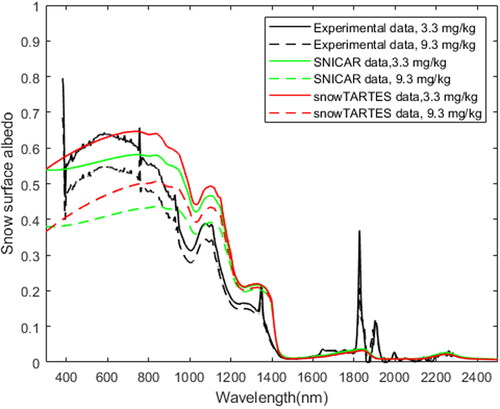
Figure 10. Experimental and SNICAR and SnowTARTES modeled albedo results for snow surface contaminated with 3.3 and 9.3 mg/kg soot.