Figures & data
Figure 1. (a) CJ pressure–temperature phase diagram showing detonation pressure in PBX-9501 and Composition B-3 compared to the regime for standard fuel combustion. (b) Molecular structure of explosives Composition B-3 and PBX 9501 alongside non-explosive ethylene and cellulose.
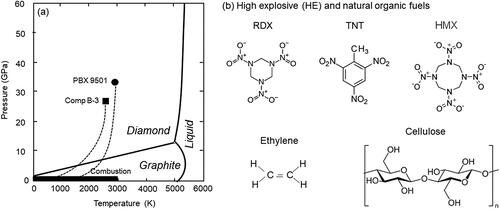
Table 1. Fuel chemistry of HE composite and biomass burning fuels including elemental ratios and oxygen balance.
Table 2. Soot emission factors and ERs from different combustion and detonation sources.
Figure 2. Mobility size distributions of HE detonation soot, laboratory-generated fullerene soot and ambient mean diameters from the Woodbury wildfire.
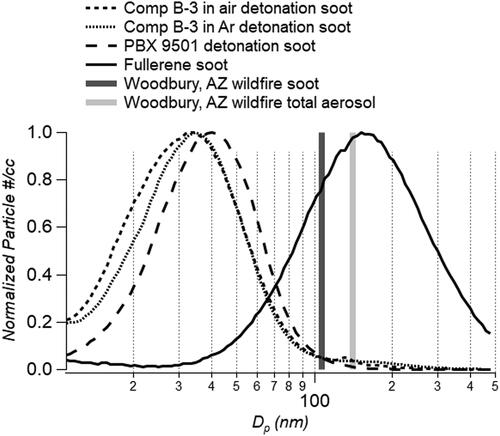
Figure 3. (a) SSA and (b) AAE of detonation soot compared with laboratory fullerene soot standard. Error bars denote standard deviation of the means.
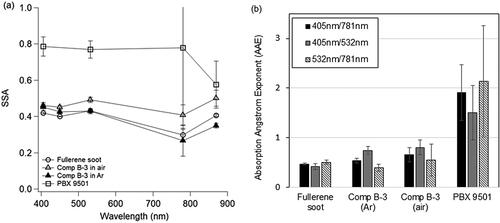
Figure 4. Organic mass spectral signatures from the (a) Woodbury, AZ wildfire, (b) fullerene soot, and detonation soot from (c) Comp B-3 in air, (d) Comp B-3 in argon, and (e) PBX 9501. Signals are normalized to one for the highest peak signal.
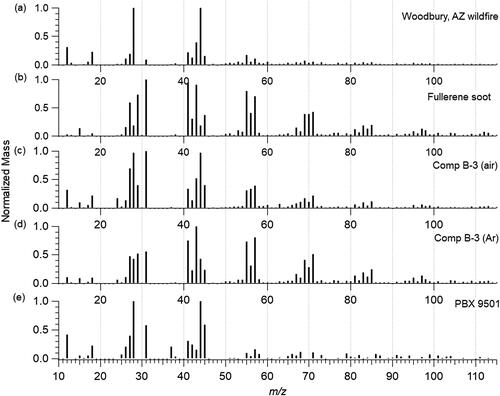
Figure 5. Carbon ion clusters (Cx+ family) from the (a) Woodbury, AZ wildfire, (b) fullerene soot, and detonation soot from (c) Comp B-3 in air, (d) Comp B-3 in argon, and (e) PBX 9501. Signals are normalized to one for the highest peak signal.
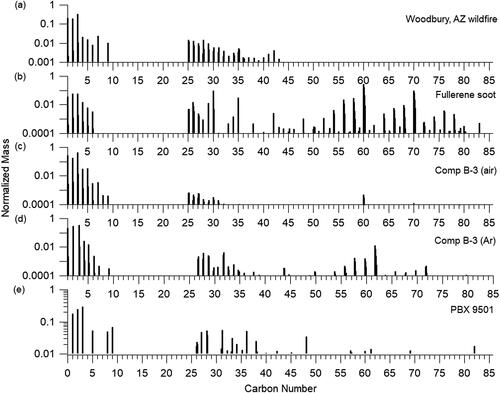
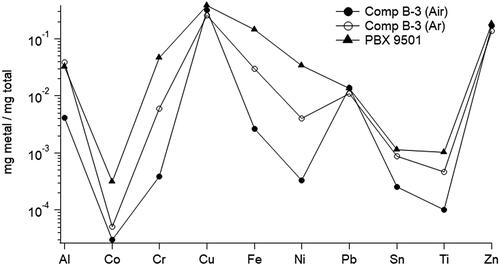
Figure 6. Metal content in HE detonation soot as detected by ICP-OES.