
Figures & data
Figure 1. Hourly averaged AAE vs. SAE with points colored by the ratio of the SVM-predicted MACBC to the value derived from empirical observations for (a) training data; (b) test data; and (c) independent validation data. In panels (a)–(c), the square marker and error bars indicate the mean and standard deviation of the dataset; the filled circles represent over-predictions, and the filled triangles represent under-predictions. The classification scheme presented in Cappa et al. (Citation2016) is shown in panel (d); this is overlaid onto panels (a)–(c).
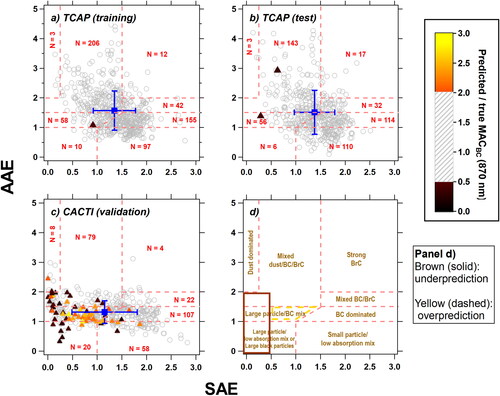
Figure 2. The ratio of the SVM-predicted MACBC to the value derived from empirical observations of MACBC as a function of (a) OA concentration; (b) BC concentration; and (c) SSA at 870 nm for the TCAP and CACTI data. The dashed line represents that the model fits MACBC.true without error.
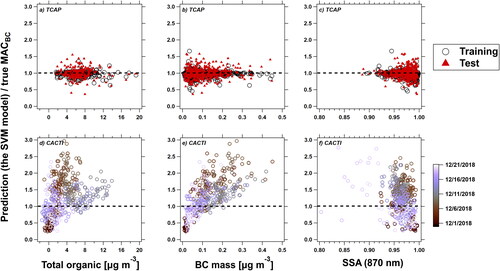
Figure 3. Association between the ratio of the SVM-predicted MACBC to the value derived from empirical observations to aerosol properties from the FIREX study. (a) The “AAE-SAE” space as in ; (b) SSA at 528 nm; (c) SSA at 870 nm; (d) the OC/EC ratio; (e) estimated Eabs; and (f) estimated mixing state. The dashed line in panels (b)–(f) represents a perfect agreement.
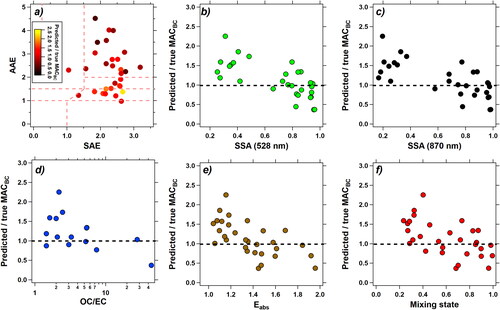
Figure 4. Statistical results of sensitivity analysis. The results of CNN applied to Case 3(a) and Case 3(b) for CACTI result in extreme prediction errors, so they fall outside of axis limits. The detailed results of R2, MSE, and fractional bias and error can be found in Tables S1 and S2. Note the different scales in panels (a) and (b).
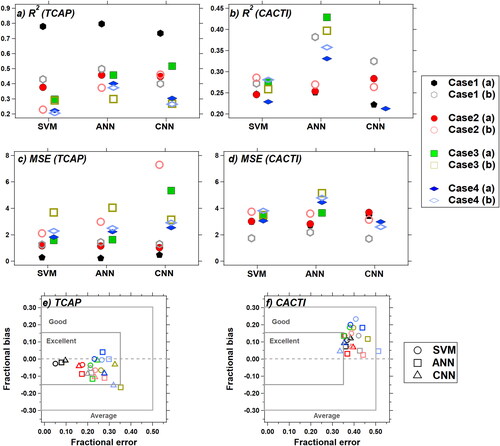
Table 1. Input variables considered in our sensitivity analyses. Multiple-λ includes information at 467, 528, and 652 nm, while single-λ only includes information at 528 nm. Values within the Ni and Vi columns represent the bounds of the particle size range (as electrical mobility diameter).