
Figures & data
Figure 1. Schematic of the 9 m3 environmental chamber used in these studies. This chamber contained four low power (4w) floor fans to ensure a well-mixed environment, a relative humidity and temperature monitor, a humidifier, Collison six-jet nebulizers to aerosolize purified murine coronavirus cultures, an optical particle counter and an aerosol condensation growth tube collector.
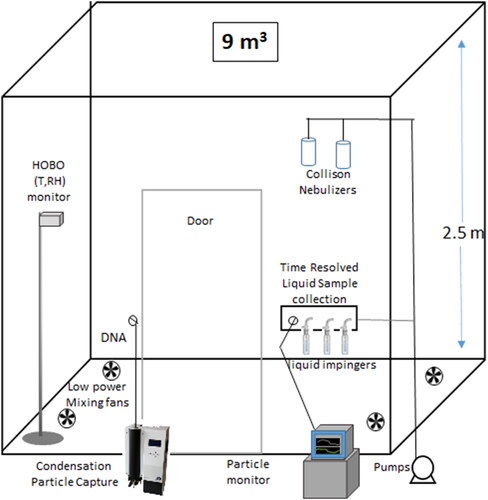
Figure 2. Particle size distribution of virus containing aerosol retained in the test chamber between 10 and 100 min of aerosol age in the presence of disinfectant vapors. (Inset) Aerosol concentration of optical diameters in range between 0.5 μm and 5 μm.
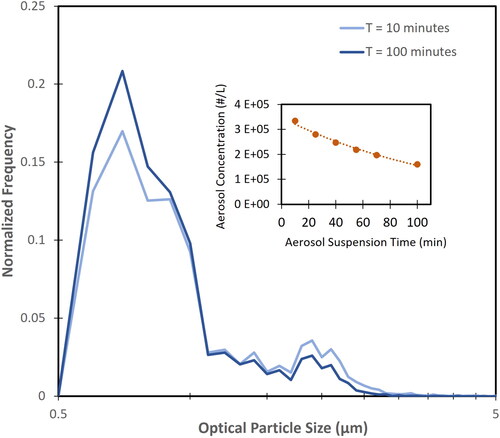
Figure 3. The average half-life and time for the two-log (99%) reduction of airborne MHV infectivity potential (TCID50) and gene copy numbers (RT-qPCR). (a) Control conditions represent the MHV response in the absence of any chemical treatment; (b) exposure conditions with gas-phase dipropylene glycol (<20 ppmv TVOC); (c) exposure conditions with HOCl vapor (<0.2 ppmv); (d) exposure conditions with H2O2 vapor (<0.9 ppmv). Bar heights represents the average and error bar presents the pooled standard deviation (n = 3 experiments each with analytical triplicates).
Figure 4. Airborne murine coronavirus (MHV) concentrations, as judged by TCID50 (o) and gene copy numbers qRT-PCR (▲), in an environmental chamber maintained at 60% RH and 22°C. (a) Control conditions represent the MHV response in the absence of any gas-phase chemical treatment; (b) exposure conditions with gas-phase dipropylene glycol (<20 ppmv TVOC); (c) exposure conditions with HOCl vapor (<0.2 ppmv); (d) exposure conditions with H2O2 vapor (<0.9 ppmv). Vertical lines (ǁ) represent termination of gas-phase disinfectant loading into the chamber. Declining horizontal lines are the regression slopes of independent exposure experiments used to calculate the average decay of triplicate experiments.
Table 1. The average half-life and 99% decay for each exposure condition. Respective decay times are reported as average ± SD (min).
Table 2. Averaged decay rate constant ± SD (min−1) or each exposure condition tabulated below graph.