Figures & data
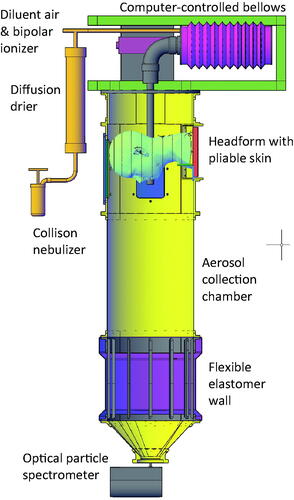
Figure 1. Source control measurement system. The system consists of an aerosol generation system, a bellows and linear motor to produce the simulated breathing, a pliable skin headform on which the source control device (such as a face mask) is placed, a 136-liter collection chamber into which the aerosol is exhaled, and an optical particle spectrometer (OPS) to measure the number and size of the aerosol particles. The system is oriented vertically as shown to minimize the loss of aerosol particles due to settling before reaching the OPS.
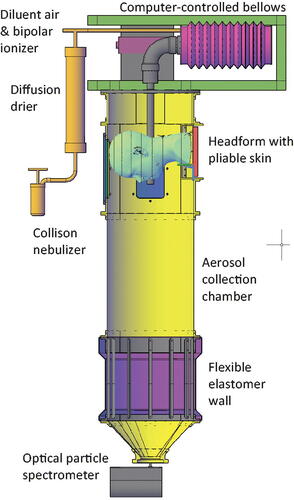
Table 1. Source control devices used in the study. The two medical face masks were tested with and without an elastic mask brace. Photos of the devices on the headform are shown in Figure S1 in the online supplemental information. Construction information is from the manufacturers.
Figure 2. Aerosol particle mass size distribution for the four airflow conditions with no source control device. These control aerosol concentrations were compared with the concentrations found when a source control device was used to determine the source control efficiency of each device. The particle diameter refers to the optical diameter and is the arithmetic mean of the size bin. Each bar shows the mean of four experiments. The error bars show the standard deviation.
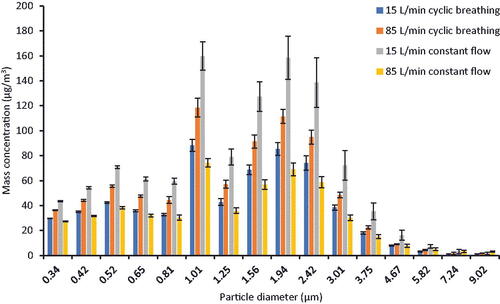
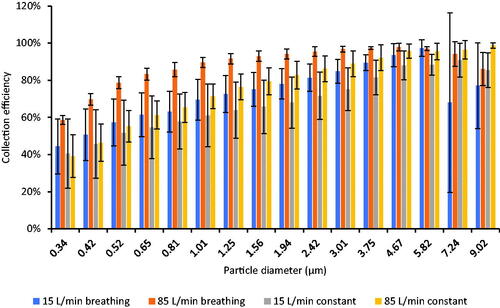
Figure 3. Collection efficiency for source control devices. The collection efficiency shown here is the overall collection efficiency based on the total aerosol mass. The collection efficiency for the 85 L/min cyclic breathing tests was higher than the collection efficiencies under the other airflow conditions, but this is most likely an artifact due to aerosol recirculation within the collection chamber as described in the Discussion section. Each bar shows the mean of four experiments. The error bars show the standard deviation.
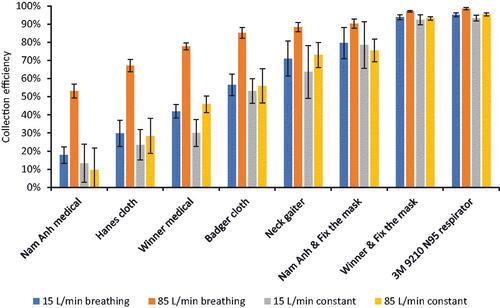
Figure 4. Source control collection efficiency vs. fit efficiency for (a) 15 L/min cyclic breathing; (b) 85 L/min cyclic breathing; (c) 15 L/min constant airflow; and (d) 85 L/min constant airflow. The fit factor is transformed to fit efficiency for the plot to allow a direct visual comparison of the parameters. Each dot is the mean of four experiments for one source control device. Error bars show the standard deviation.
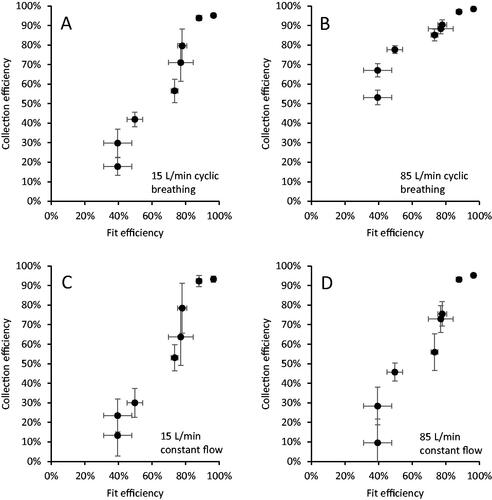
Table 2. Aerosol size distribution characteristics for the four airflow conditions. The aerosol optical size distributions were measured with no source control device on the headform using the OPS. Each parameter is the mean of four experiments.
Table 3. Experimental results. The Buff neck gaiter was worn doubled over to form two layers of fabric. The Winner and Nam Anh medical face masks were tested both as normally worn and with a Fix the Mask elastic mask brace over the mask to reduce the face seal leakage (see Figure S1 in the online supplemental information for photographs). Because the Fix the Mask fits around the perimeter of the mask, the filtration efficiency and airflow resistance for these masks are the same with and without the Fix the Mask, and thus separate filtration efficiency and airflow resistance tests were not performed. The source control collection efficiency and fit factor results are the mean and standard deviation of four experiments. The filtration efficiency and airflow resistance are the mean and standard deviation of three experiments, except for the Hanes mask (N = 10) and the 3 M N95 respirator (N = 20).
Table 4. Significance of differences between source control collection efficiencies for different airflow conditions. The table shows the adjusted p-values (adj p-value), central estimates (CE) and confidence intervals (CI). Each device was tested four times at each airflow condition.
Table 5. Correlation coefficients for fit factor and filtration efficiency vs. collection efficiency.
Figure 5. Source control collection efficiency vs. filtration efficiency of the device material for (a) 15 L/min cyclic breathing; (b) 85 L/min cyclic breathing; (c) 15 L/min constant airflow; and (d) 85 L/min constant airflow. Each dot is the mean of four experiments for one source control device. Error bars show the standard deviation.
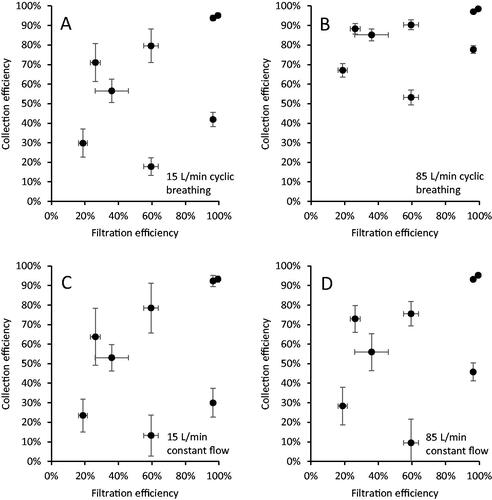
Figure 6. Collection efficiency vs. particle optical diameter for the Buff neck gaiter. Results for other source control devices are shown in Figure S6. Each bar shows the mean of four experiments. The error bars show the standard deviation.