
Figures & data
Table 1. Comparison of reported flame-made silica characteristics found in selected studies in the literature measured with in-situ techniques.
Figure 1. Experimental setup for the synthesis of the SiO2 nanoparticles with a co-flow diffusion flame burner. Reprinted from ‘Nanostructure evolution: from aggregated to spherical SiO2 particles made in diffusion flames’, by A. Camenzind, H. Schulz, A. Teleki, G. Beaucage, T. Narayanan and S.E. Pratsinis, European Journal of Inorganic Chemistry, 2008, vol. 6, p. 911–918. Copyright Wiley-VCH GmbH. Reproduced with permission.
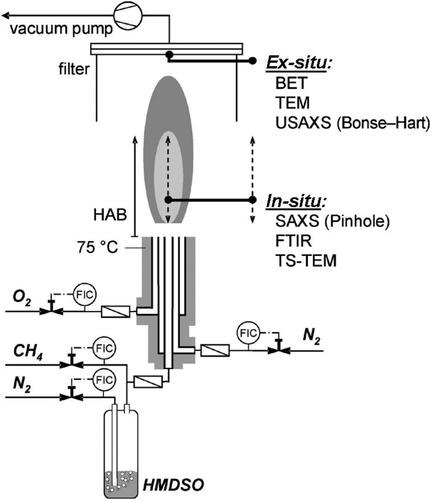
Table 2. Global two-step reaction mechanism for HMDSO combustion (Feroughi et al. Citation2017).
Table 3. Characteristic sintering times for silica nanoparticles tested in the current study.
Figure 2. Contour plots of (a) velocity and (b) temperature fields.
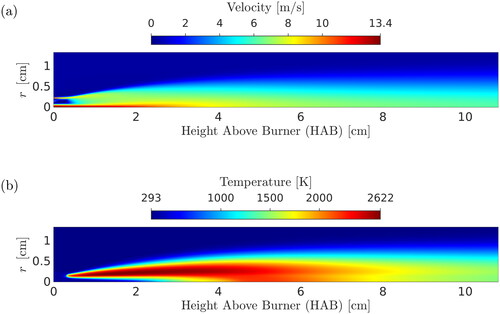
Figure 3. Contour plots of (a) silica volume fraction and (b) primary particle diameter fields.
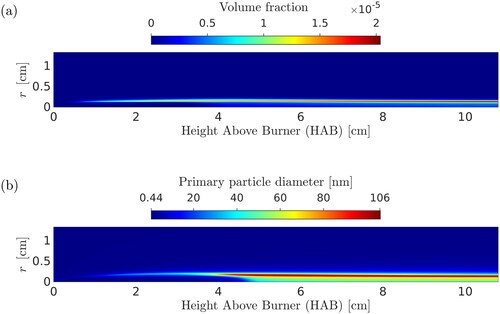
Table 4. Inlet boundary conditions, where denotes the stream bulk inlet velocity in the streamwise direction.
Figure 4. Comparison of numerical predictions (two-PBE model) with the experimental FTIR data of Camenzind et al. (Citation2008) for flame temperature along the centerline and effect of radial averaging. An average experimental error of 60 K given by Kammler et al. (Citation2002) was used in the figure for the FTIR data.
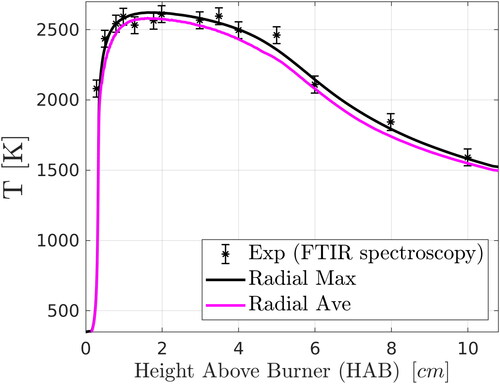
Figure 5. Comparison of numerical predictions (two-PBE model) with experimental data for flame temperature and effect of emission of thermal radiation from gas species and from particles. Results of the radial maximum temperature for each case are compared with the experimental FTIR data of Camenzind et al. (Citation2008). An average experimental error of 60 K given by Kammler et al. (Citation2002) was used in the figure for the FTIR data.
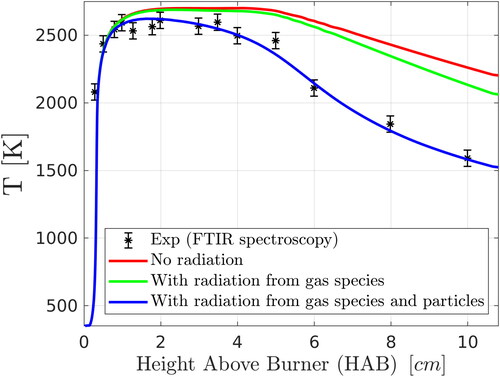
Figure 6. Comparison of the experimental SAXS data of Camenzind et al. (Citation2008) with numerical predictions for (a) primary particle diameter, (b) radius of gyration of aggregates, (c) primary particle number concentration and (d) average number of primary particles per aggregate along the pathline of maximum silica volume fraction. Results were obtained with the two-PBE, the extended one-PBE, and the monodisperse model (described in Section 2).
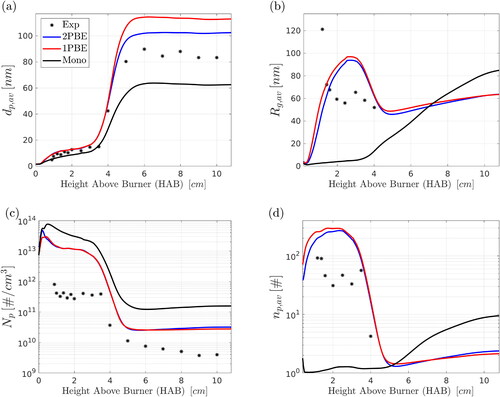
Figure 7. Comparison of the experimental SAXS data of Camenzind et al. (Citation2008) with numerical predictions for the geometric standard deviation of aggregate (agg) and primary particle (pp) size distributions along the pathline of maximum silica volume fraction.
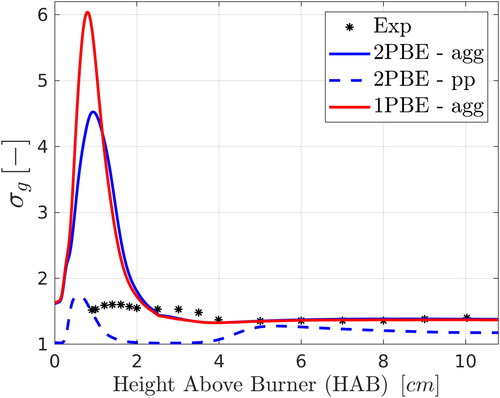
Table 5. Definition of timescales for processes encountered in silica flame synthesis.
Figure 8. Rates (absolute values) of kinetic processes (a) and timescales (b) along the pathline of maximum silica volume fraction. Results were obtained with the two-PBE model. Note that, for the sintering process in (a), the rate refers to the number concentration of primary particles,
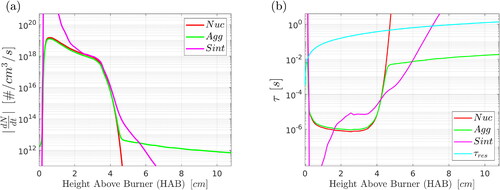
Figure 9. Effect of sintering time on (a) primary particle diameter, (b) aggregate radius of gyration. Results were obtained with the two-PBE model. Comparison is also made with the experimental data of Camenzind et al. (Citation2008).
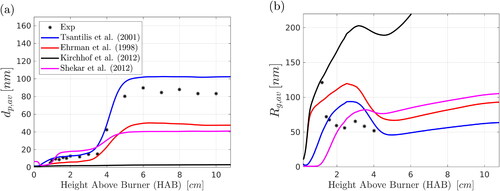
Figure 10. Effect of nucleation model on (a) primary particle diameter and (b) aggregate radius of gyration. Three models are compared: instantaneous nucleation (InstNuc), classical nucleation theory (CNT) and the dimers-based approach that was used for the rest of the results. Results were obtained with the two-PBE model. Comparison is also made with the experimental data of Camenzind et al. (Citation2008).
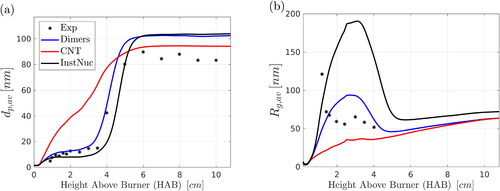
Table 6. Comparison of PBE models for describing aerosol dynamics and particle morphology.