Figures & data
Figure 1. Experimental Setup to determine the CE with either atomized or furnace-generated aerosol. The flow of the aerosol-free gases was regulated with a mass flow controller. The aerosol was either generated with an atomizer or in a tube furnace before it entered the rotating disk diluter. The diluted aerosols then entered the DMA for classification and a static mixer before it was measured with a reference and test CPC. SMPS scans were also performed to evaluate the PSD.
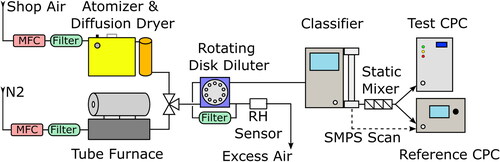
Table 1. Table of salt properties.
Figure 2. PSDs and their respective GMD indicated with squares of several atomized salt solutions. Each respective aerosol was diluted at a DR of 1:50 and a temperature of 55C. Two different molar salt concentrations were used.
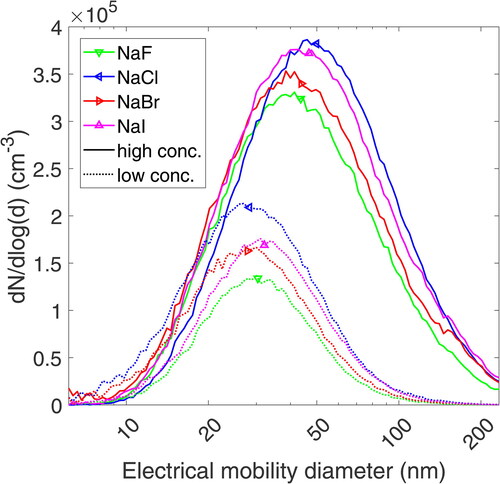
Figure 3. CE of NaCl, NaBr, NaF, and NaI particles generated via atomization and evaporation-condensation method. The color indicates the particle coposition. Aerosol generated with the tube furnace is indicated with a star in the legend and shown with quadrilaterals. The black boxes indicate regulatory requirements at 23 and 41 nm. The CE of atomized aerosol particles is shown with triangles.
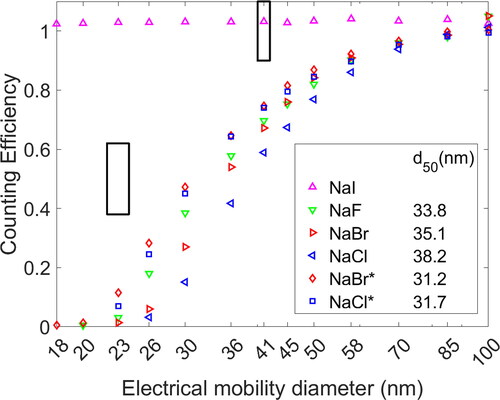
Figure 4. CE of NaCl particles for different DRs. Two solute concentrations and tube furnace-generated aerosol was evaluated. The temperature of the furnace was set at 725C. The color indicates the DR which was used. The marker type indicates how the particles were generated.
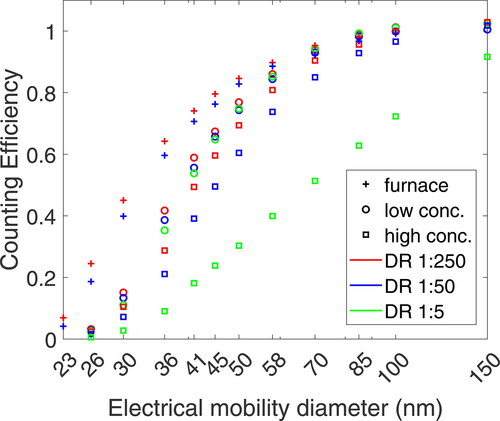
Figure 5. Linearity measurements of atomized salts with high molar concentrations at 41 nm (a, left) and 70 nm (b, right). The CE stated in the legend indicates the CE of the test CPC measured at the highest DR of 1:250. This CE is also plotted as a solid line to act as a guide to the eye.
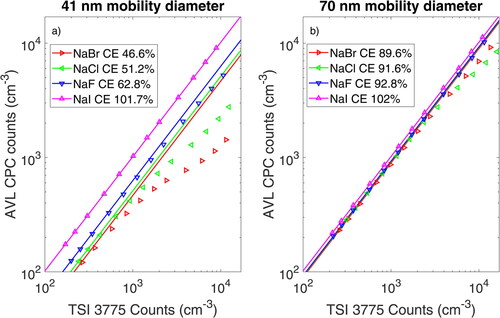
Figure 6. CE of NaCl particles at three dilution temperatures. (a) Influence on the dilution rate for several concentrations and DRs for atomized NaCl particles with high solute concentrations. (b) Comparison of NaCl particles generated in a tube furnace and with an atomizer with a low solute concentration at DR of 1:250.
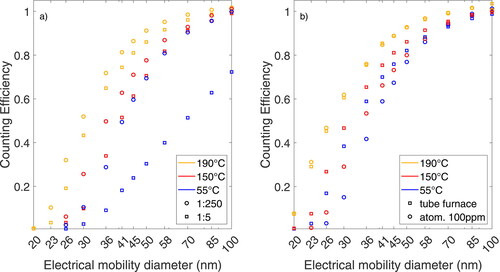
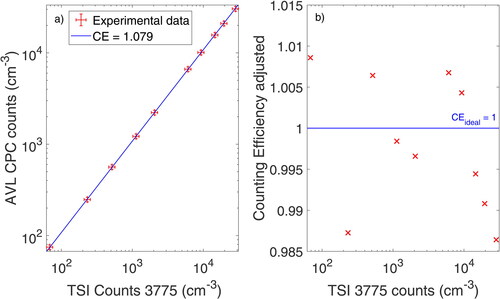
Figure 7. (a) Linearity measurement of the AVL CPC with atomized NaI including the respective counting uncertainty of each CPC. The CE in the legend is the averaged CE over 10 measurements. (b) CE adjusted with the correction factor obtained from monodisperse measurements.