Figures & data
Figure 1. Results from the analytical bolus model (“in silico”) are compared to in vivo data (Borgstrom et al. Citation1994; Duddu et al. Citation2002; Newman et al. Citation2000). Six different comparisons, indicated by superscripted bracketed numbers, are made for the extrathoracic region (“ET”) and the lungs (“lung”) deposition. in vivo data for conditions (1) and (2) are taken from Duddu et al. (Citation2002). Condition (3) is taken from Borgstrom et al. (Citation1994). Conditions (4), (5), and (6) are taken from Newman et al. (Citation2000). LPM is an abbreviation for liters per minute (L/min). The particle size is the mass median aerodynamic diameter (MMAD). The orange bars (“in silico”) represent data from the current analytical model. The blue bars (“in vivo”) are the average values for conditions (1), (2), and (3), and the black lines represent one standard deviation. For conditions (4), (5), and (6), the blue bars are the median values, and the black lines with asterisks (*) represent ranges. Particle size distribution for each case is given in Supplementary Information 7.
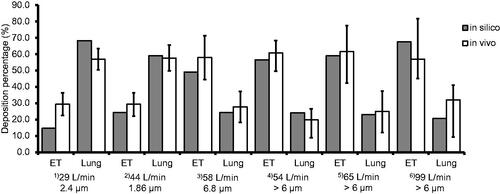
Figure 2. The difference in deposition fraction between high (2000 mL/s) and low (500 mL/s) flow rate is shown for total lung and regional lung (large tracheobronchial, small tracheobronchial, and acini) deposition (n = 3). The error bars represent the standard deviation. The difference increases above 0.05 at 1.0 µm for large tracheobronchial and acini deposition.
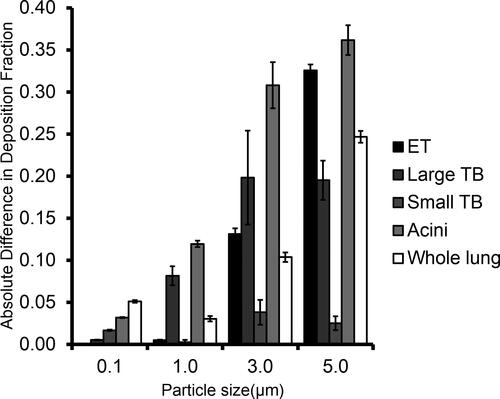
Figure 3. Contour plots showing the relationship between aerodynamic particle diameter (x-axis), flow rate (y-axis), and particle deposition (color boundaries) in (a) large tracheobronchial, (b) small tracheobronchial, (c) acini, and (d) whole lung. The x-axis is in a log-10 scale of aerodynamic particle diameter (µm) and ranges from −1.0 (0.1 µm) to 0 (1.0 µm).
Figure 4. Contour plots show the relationship between aerodynamic particle diameter (x-axis), flow rate (y-axis), and particle deposition (color boundaries) in the whole lung. The x-axis is in a log-10 scale of aerodynamic particle diameter (µm), and it ranges from 0.00 (1 µm) to 0.477 (3 µm). Red dashed lines represent the threshold particle diameters whose deposition is independent of flow rate below the diameter. The threshold aerodynamic particle diameter for whole lungs 1.2 µm.
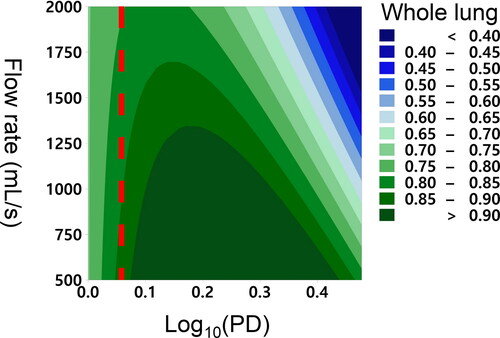
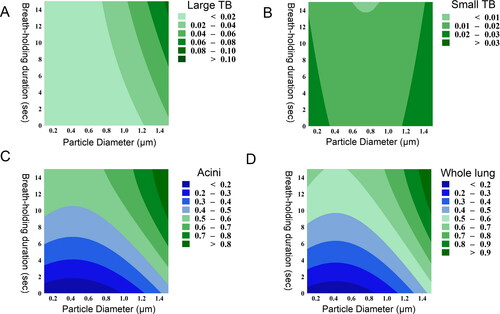
Figure 5. Contour plots show the relationship between aerodynamic diameter (x-axis), breath-holding time (y-axis), and particle deposition (color boundaries) in (a) large tracheobronchial (Large TB), (b) small tracheobronchial (Small TB), (c) acini, and (d) whole lung.