
Figures & data
Figure 1. A comparison of results from field samples in three categories: Total - (dark gray), PCR-positive - (light gray), and infectious samples (white). Swab samples are from high-touch surfaces, and all other samples are from air samplers. (a) Shows sample counts by Instrument. The BC-251 contains two cyclone and one filter sample collection stages. 66 individual BC-251 samples are shown here as 22 since all three stages from a single sampler were combined. Only the second BC-251 cyclone stage (1-4 μm particles) collected detectable virus. BioSpot-1 and BioSpot-2 refer to two separate instruments of the same model which, along with VIVAS, employ water-based condensation particle growth technology (b) Depicts sample positivity rates by Sampler Type. BioSpot-1, BioSpot-2, and VIVAS comprise the “Condensation” group based on their common particle collection mechanism. BC-251 samples fully comprise the “Non-Condensation” group. By Fisher’s exact tests, significant difference exists between these rates based on type of air sampler (p ≪ 0.05).
Figure 2. SARS-CoV-2 detected by RT-qPCR according to the Sampler Type used to collect air samples, depicted with (a) all data included and samples with non-detectable virus shown as zero-values, and (b) only samples where virus was detected. Significant p-values according to Wilcoxon rank sum tests are shown with asterisks, and “ns” indicates no statistically significant difference.
Table 1. Results from mixed effects hurdle models.
Table 2. Wilcoxon rank sum tests results following pairwise comparisons within categorical explanatory variables.
Figure 3. SARS-CoV-2 detected by RT-qPCR according to the occupancy frequency of the sampling location, depicted with (a) all data included and samples with non-detectable virus shown as zero-values, and (b) only samples where virus was detected.
Figure 4. Viable SARS-CoV-2 isolated in Vero E6 cells according to the occupancy frequency of the sampling location, depicted with (a) all data included and samples with non-detectable virus shown as zero-values, and (b) only samples where the culturing of viable SARS-CoV-2 was successful.
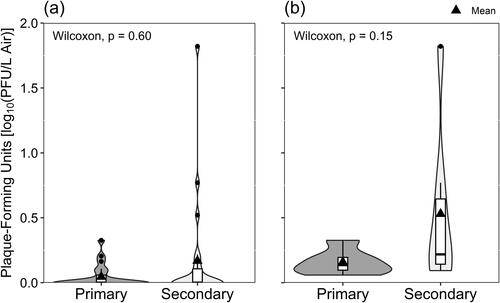
Figure 5. Resultant concentration of SARS-CoV-2 detected by RT-qPCR in surface swab samples, shown with all sample data included and undetectable virus concentrations plotted as zero-values (All Samples) and with only samples containing detectable virus concentrations (Positives).
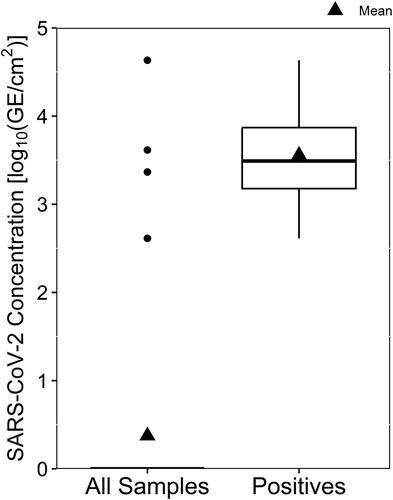
Table 3. Detection of SARS-CoV-2 and culture of viable virus from surface swabs.