Figures & data
Figure 1. Integrated volume method experimental setup. Direction of air flow is indicated by red arrows.
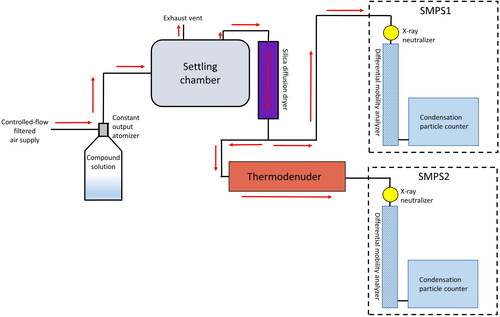
Figure 2. Flow setup of aerosol generation and TDMA setup. Red arrows indicate flow direction of air (aerosol sample).
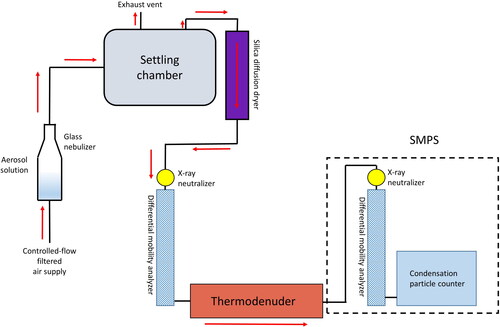
Figure 3. Temperature vs. volume change data used for fitting of Csat,0 and ΔH for proline and the modeled data generated by the fitted values of Csat,0 and ΔH in EquationEquation (3)(3)
(3) . Data were binned and averaged at intervals of 2 °C (with standard deviations used for error bars) to prevent the Levenberg-Marquardt least-squares fitting algorithm from biasing the fit for lower temperatures, where a larger number of raw data points were taken. Plotted over the temperature-averaged data is also the modeled resultant curve generated from the fitted parameters of the IVM EquationEquation (3)
(3)
(3) .
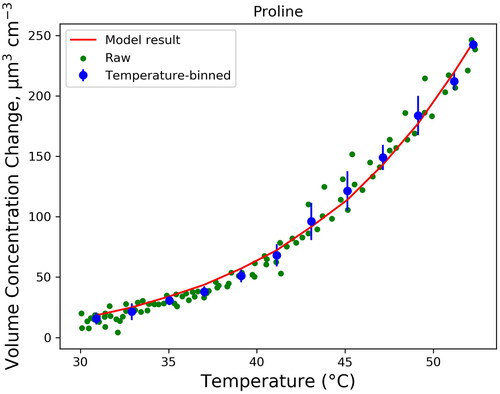
Table 1. Fit results of Csat,0 and ΔH for the tested bioaerosol compounds, calculated at 25 °C.
Table 2. Summary of previous studies measuring or modeling ΔH for the seven compounds of interest in this study.
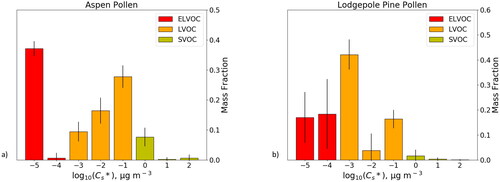
Figure 4. Volatility basis sets for (a) aspen pollen and (b) lodgepole pine pollen.