Figures & data
Figure 1. Schematic of the scattering process within the PMS5003. d1 is the distance from the laser to the particle, d is the distance from the particle to the photodiode, θ is the scattering angle, ϕ is the angle of the scattering plane relative to the vertical, and α is the ray’s angle of arrival relative to the orthogonal of the photodiode.
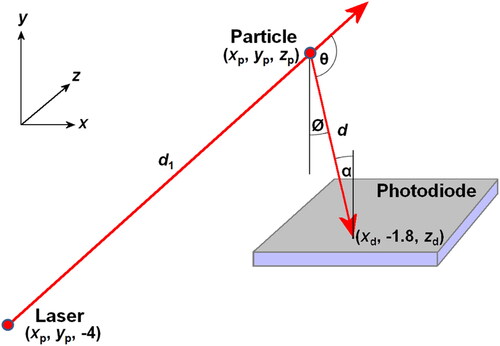
Figure 2. The laser beam intensity in the y-z plane at x = 0, using EquationEquation (3)(3)
(3) and the measured values of w0, z0, and P. The laser enters the scattering chamber at z = -4 mm and leaves it at z = +4 mm. Note the logarithmic color scale.
 and the measured values of w0, z0, and P. The laser enters the scattering chamber at z = -4 mm and leaves it at z = +4 mm. Note the logarithmic color scale.](/cms/asset/29c60b1c-e0fe-4679-8299-8f558863e9e5/uast_a_2285935_f0002_c.jpg)
Figure 3. Model-predicted peak scattered light power as a function of particle diameter for a 2.36⋅10−3-W, 657-nm focused Gaussian laser and homogeneous spheres of 1.52 + i0.002 refractive index.
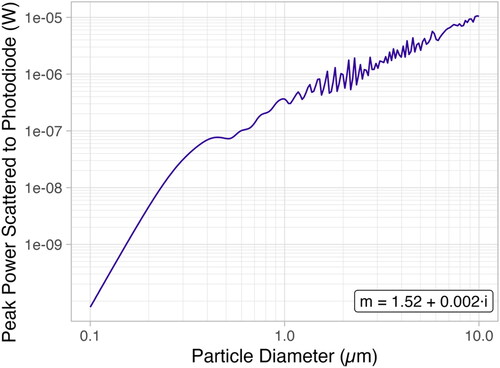
Figure 4. Model-predicted cumulative frequency of scattered light power for different particle diameters assuming a refractive index of 1.52 + i0.002.
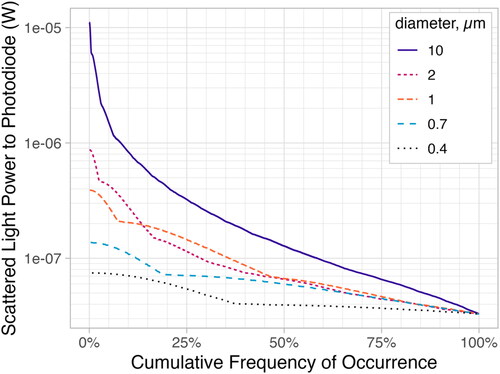
Table 1. Model-predicted fraction of particles being sized correctly, as a function of percent of peak power.
Table 2. Model-predicted apportionment of particles of various diameters to PMS5003 particle size bins.
Figure 5. Mass scattering efficiency (MSE) for dry ammonium sulfate aerosol (density = 1.7 g cm−3; refractive index at 657 nm = 1.51 + 0i). The theoretical MSE is shown by the solid line. The truncated PMS5003 MSE, shown by the dashed line, is calculated from EquationEquation (14)(14)
(14) with T(Dp) from .
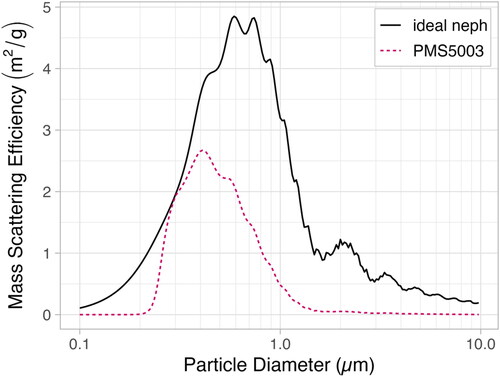
Figure 6. PMS5003- and APS3321-reported number concentration distributions for 0.27 and 2.0 µm PSL spheres (m = 1.59 + 0.0i). The relative count fractions for the PMS5003 are nearly constant for the two aerosols, despite the differences captured by the APS.
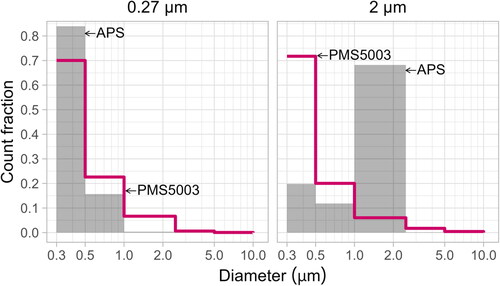
Figure 7. PMS5003 scattering coefficient truncation vs. scattering coefficient median diameter. The dashed line is a fit of the model-predicted fraction of particles that are sized correctly (50% of peak power) from . The solid line assumes the Plantower-reported 50% counting efficiency at 0.30 µm and 1% counting efficiency at 0.20 µm. The points are scattering coefficient ratios that were calculated from aerosol size distribution data collected by Tryner et al. (Citation2020b) and Kaur and Kelly (Citation2023b) using the relationship between scattering efficiency and PMS5003-reported count of particle > 0.3 µm reported by Ouimette et al. (Citation2022).
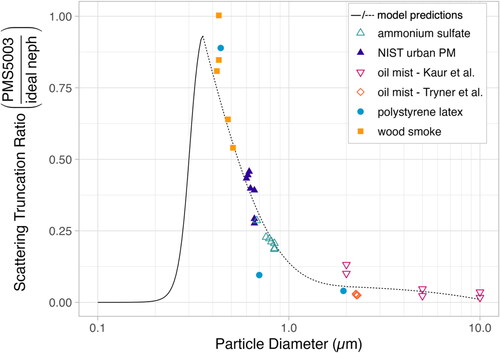
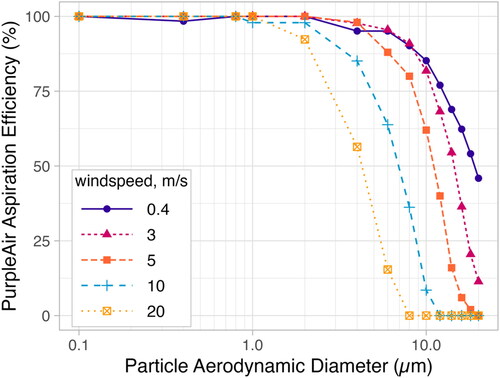
Figure 8. Sampling efficiency of particles as a function of aerodynamic diameter and ambient wind-speed.