
Figures & data
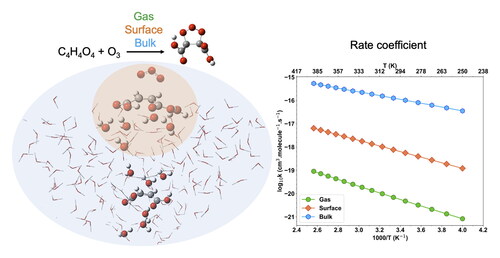
Table 1. Calculated pre-reactive complex equilibrium parameters [ΔG° (kcal.mol−1), Keq, and Kc (cm3.molecules−1)] for the various studied environments: gas phase, surface and bulk.
Table 2. The fitted parameters using the modified Arrhenius equation for the primary reaction of maleic acid with ozone for the various studied environments (A in cm3. molecule−1. s−1 and s−1 for the bimolecular and the unimolecular reaction rate coefficients, respectively; E in kcal.mol−1).
Figure 1. Time evolution of the position (z-coordinate) of one maleic acid molecule along 60 ns. The yellow area represents the interfacial region, where the water density is between 10% and 90% of its bulk value shaded in blue.
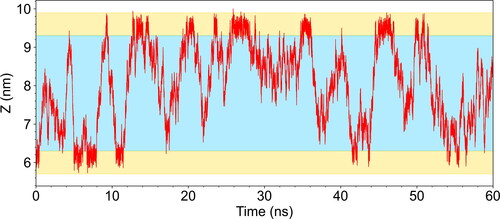
Figure 2. Density profiles from MD simulations of 20 MA in aqueous solution at 298 K.
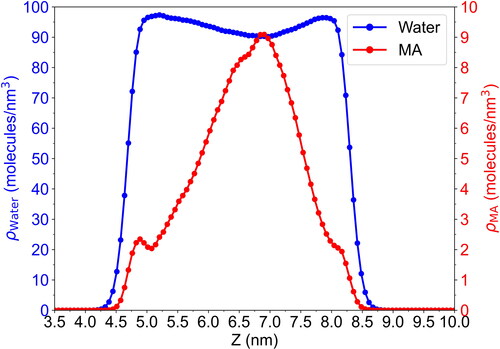
Figure 3. (a) Binding energy distributions for the MA–MA interactions and MA–H2O interactions, and (b) probability distributions for MA to form H-bonds in aqueous solution. Red and blue curves correspond to the binding of the MA molecule with all other MA molecules and with all water molecules respectively.
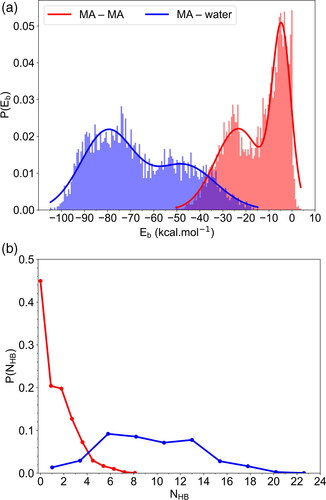
Figure 4. (a) Radial distribution functions and (b) coordination number analysis of the selected maleic acid, both on the surface and in the bulk, in relation to the water oxygens. The blue symbols correspond to the radius of the extracted formations. The RDFs were calculated for a small-time interval (100 ps) and subsequently normalized to reduce noise and improve clarity in the figure.
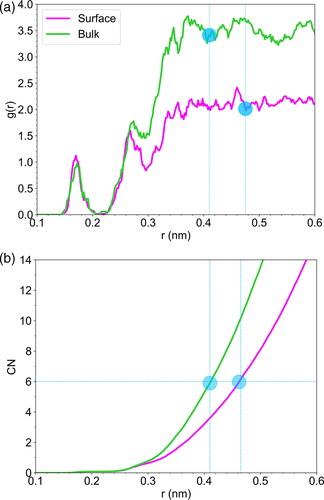
Figure 5. Structural changes of MA occurring during the gas phase O3 + MA reaction based on the optimized geometric parameters at the M06-2X/6-311++G** level. RC, TS and P stands for reactant complex, transition state and product. Note that for the reactants at infinite distance (on the left), O3 is not represented.
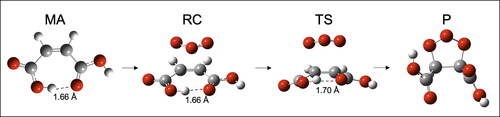
Figure 6. (a) Relative energy profile for the 1,3-dipolar cycloaddition reaction of ozone to MA in different environments: gas phase, Eley–Rideal mechanism (ER), and Bulk-PCMbi. The potential energies, expressed in kcal.mol−1, were predicted using single point CCSD(T) level and zero-point correction on DFT geometries. (b) Rate coefficients for the bimolecular reactions of O3 + MA over a temperature range of 250–400 K. Calculations performed at the CCSD(T) level using the TST and CVT/SCT methods for the gas phase reaction, and CVT/SCT for the ER and Bulk-PCMbi reactions. Markers indicate the rate coefficients calculated at various temperatures, while lines correspond to the fit using the modified Arrhenius equation.
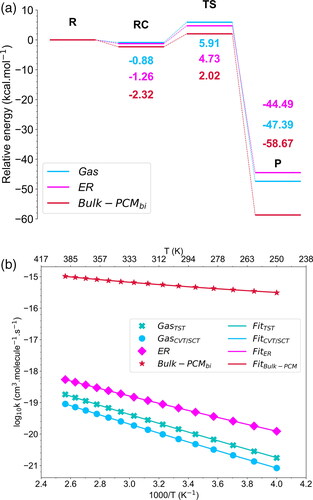
Figure 7. Molecular representation of the fully explicit QM/QM' model at the surface (a) and the Bulk (b). (c) represents the Bulk-PCM description where the QM’ part is replaced by a dielectric continuum (PCM). The transition state in the high-level region (QM) is observed for both cases, as well as in the Bulk-PCM environment based on the optimized geometries at the M06-2X/6-311++G** level.
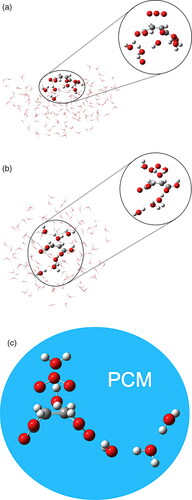
Figure 8. (a) Relative energy profiles for the 1,3-dipolar cycloaddition reaction of ozone to MA in different environments: Langmuir Hinshelwood framework (LH), ONIOM bulk and Bulk-PCMuni. The potential energies, expressed in kcal.mol−1, were predicted using the CCSD(T) level and zero-point correction on DFT geometries. (b) Rate coefficients for the unimolecular reactions of O3 + MA over a temperature range of 250–400 K. Calculations were performed at the CCSD(T) level using the CVT/SCT method. Markers indicate the rate coefficients calculated at various temperatures, while lines correspond to the Arrhenius fit.
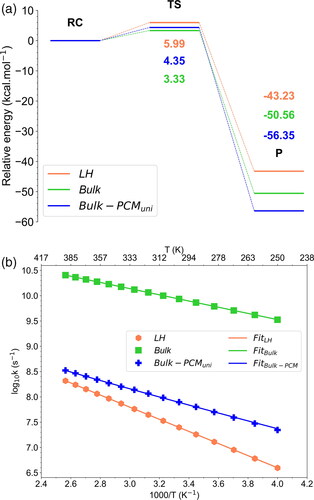
Table 3. Reported bimolecular reaction rate coefficients (L.mol−1. s−1 and cm3.molecule−1. s−1) of ozone with maleic acid in aqueous solution compared to present work.