Figures & data
Table 1. List of experiments used in this study.
Figure 1. Schematic diagrams of the experimental set-up options. Initial particles could be prepared as: (a) all positively charged, (b) all negatively charged, (c) at charge equilibrium (neutralized), (d) no particle charges (neutral).
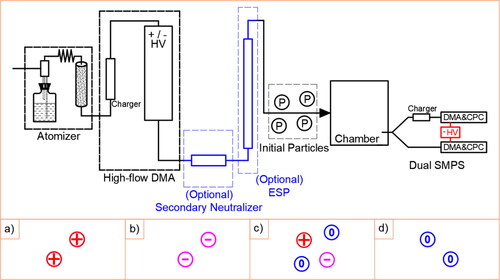
Table 2. Single-size particle charge distribution at Fuchs’ charge equilibrium.
Figure 2. (a) Averaged monodisperse particle decay rates as a function of size in UCR collapsible chambers and (b) Fuchs’ total charge percentage as a function of particle size.
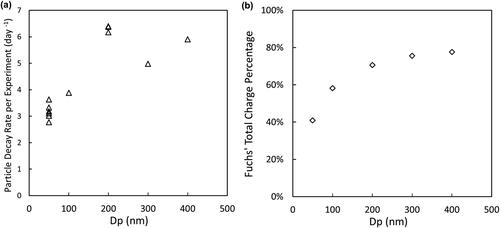
Figure 3. Dual-SMPS measurements on monodisperse particle wall-loss at two typical sizes, (a) 50 nm and (b) 200 nm during a characterization experiment. The blue curves represent normalized total particle number concentrations, measured by SMPS with charger; the red curves represent normalized positively-charged particle number concentrations, measured by SMPS without charger; (c) 50 nm total particle decay rates in four quartiles from the five selected characterization experiments.
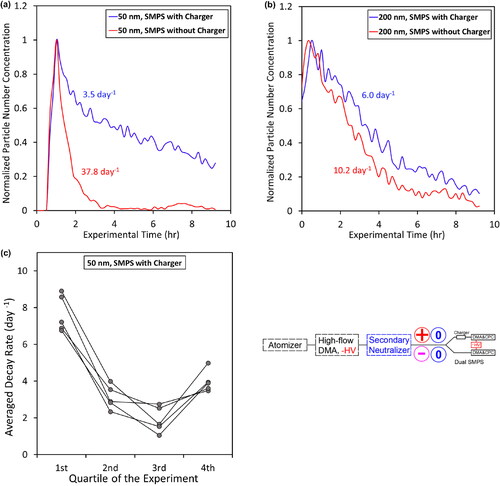
Figure 4. Dual-SMPS measurements on monodisperse particle wall-loss at two typical mobility sizes, 50 and 200 nm, during three typical types of characterization experiments. (a) Neutral-only, (b) positively-charged only and (c) negatively charged only particles were injected to the chamber, respectively. The blue/teal curves were measured by SMPS with charger while the red/pink curves were measured by SMPS without charger, detecting only the positively charged particles suspended in the chamber. The red/pink curves in (a1), (a2), (c1) and (c2) are visually scaled up by 4 times on the right-hand side y-axis.
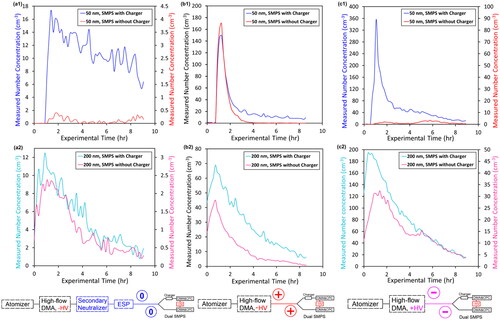
Figure 5. Comparison of the averaged size-dependent measured particle loss pattern obtained from polydisperse experiments (black curve) and the averaged size-dependent coagulation-free particle wall-loss pattern obtained from monodisperse experiments (blue curve) in UCR 90-m³ collapsible chambers.
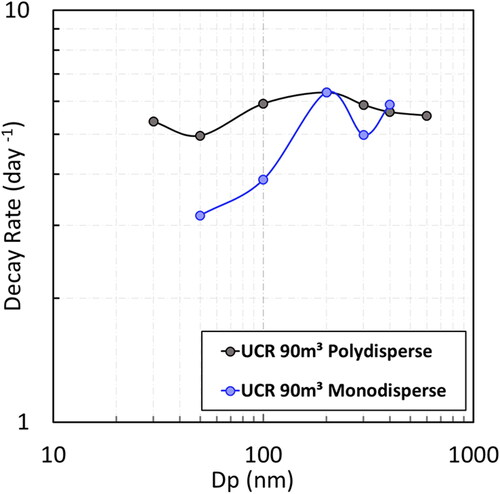
Figure 6. Averaged size-dependent measured particle loss patterns from experiments designed with increased particle number loadings (in units of cm−3) in UCR 37.5-m³ chamber.
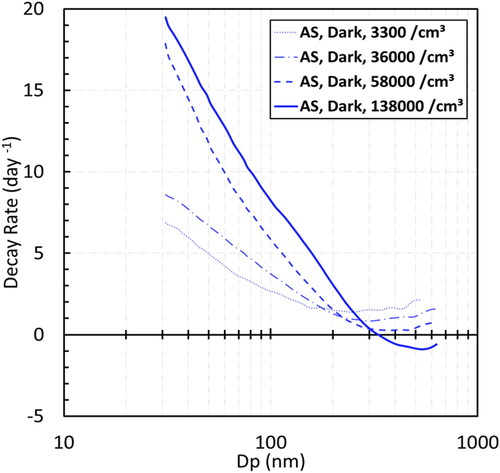
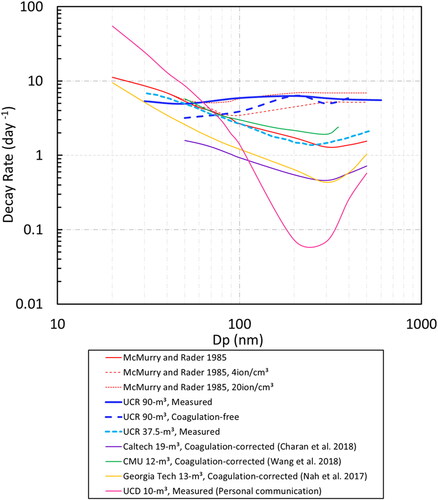
Figure 7. Inter-comparison of averaged size-dependent particle number loss patterns among different chamber facilities or calculations. “Measured” represents measured particle loss (including particle wall-loss and coagulation); “Coagulation-corrected” represents particle wall-loss rates that are post-corrected with theoretical coagulation rates; and “Coagulation-free” represents particle wall-loss rates obtained from monodisperse particle injection experiments in this study, where coagulation is negligible due to their low particle number loadings.