
Figures & data
Figure 1. Average survival fractions (Sp) for virions in particles vs. fluence (F), for UV rate constant for inactivation k = 2.3 cm2/mJ at 222 nm for 90-nm diameter virions within spherical host particles of dry BELF (85% solids) having mi = 0.0097 and the host diameters indicated. The particles are illuminated with UV light from 300 randomly chosen directions (100 directions for 6-µm hosts; 150 directions for 5-µm hosts). Lines, starting from the left of the figure, are for the 1-µm host (green, dashed), individual virion (black, solid), 2-µm host (blue, solid), 3-µm host (orange, dot-dash), 4-µm host (red, dotted), 5-µm host (cyan), and 6-µm host ((purple). The F = 10 mJ/cm2 could be obtained with 5 min of UV at the limit I222_eye_86m = 2 mJ cm−2 min−1.
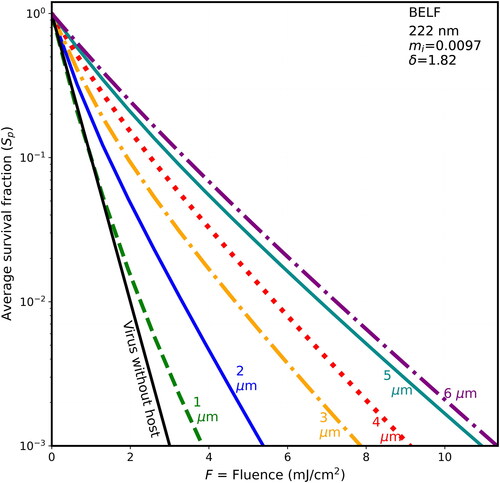
Table 1. Absorptivities (liter mole−1 µm−1 and cm3/g µm−1) of the main UV absorbing molecules in the respiratory fluids considered.
Figure 2. Average survival fractions (Sp) vs. F for 90-nm virions within spherical particles as in , with λ = 222 nm, except the host particle is of dried saliva (only 15% water mass fraction) with mi = 0.0116 and penetration depth = 1.529 µm.
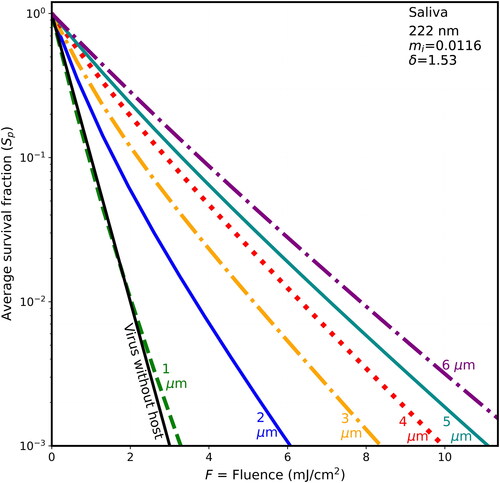
Table 2. Concentrations (g/cm3) of the biochemicals contributing to the mi, and the mi at 222 and 254 nm for the five materials listed.
Figure 3. Average survival fractions (Sp) vs. F for 90-nm virions within spherical particles of dry mucus (85% solids) as in , except that the host particle has mi = 0.0146, and the penetration depth is 1.21 µm.
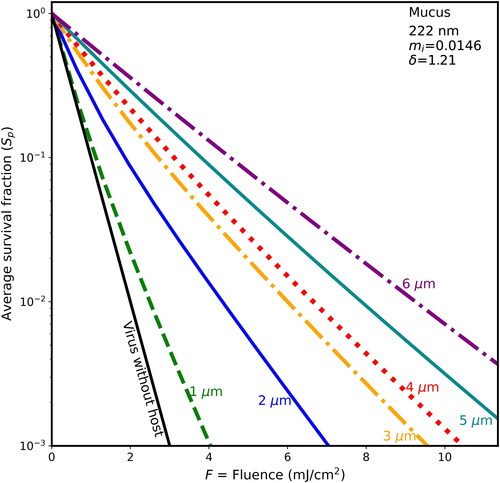
Table 3. The imaginary component of the refractive index (mi), at 222 and 254 nm for the five materials and compositions listed in Table 2.
Table 4. The imaginary component of the refractive index (mi), penetration depth (δ), and real component of the refractive index (mr) at 222 and 254 nm for the five materials and compositions listed in Tables 2 and 3.
Figure 4. Average survival fractions (Sp) vs. F for 90-nm virions within spherical host particles as in with λ = 222 nm, except the host particle is dried thick mucus (85% solids), mi = 0.02, and the penetration depth is 0.8 µm.
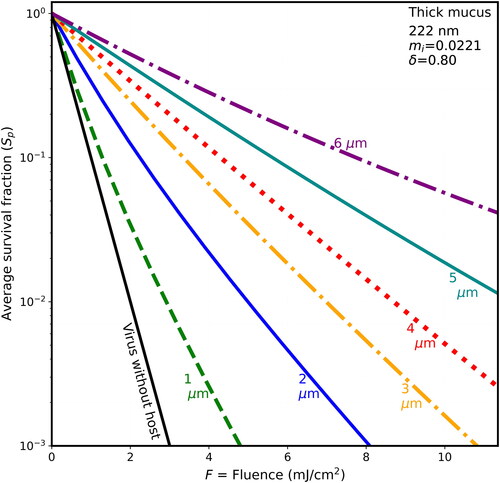
Figure 5. Average survival fractions (Sp) vs. F for 90-nm virions within spherical particles of dry BELF (85% solids), as in , except that the wavelength is 254 nm; the UV rate constant for inactivation (k) is 1.7 cm2/mJ; the mi is 0.00068; and the penetration depth is 29.55 µm as listed in the upper right of the figure.
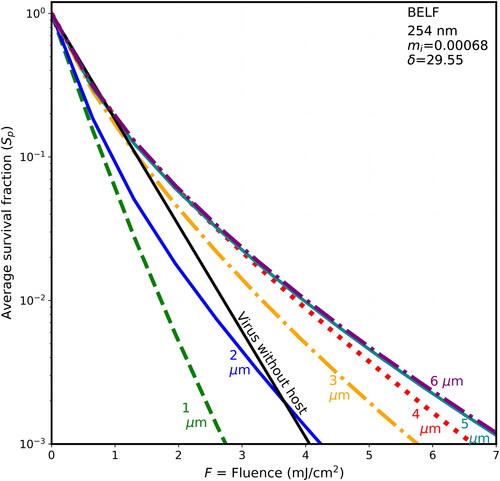
Figure 6. Average survival fractions (Sp) vs. F for 90-nm virions within spherical particles as in with λ = 254 nm, except the host particle is of dried saliva and the penetration depth is 3.145 µm.
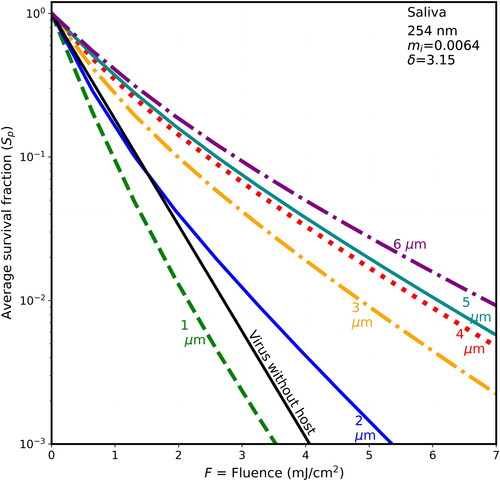
Figure 7. Average survival fractions (Sp) vs. F for 90-nm virions within spherical particles as in , with λ = 254 nm, except that the host particle is of dried mucus (85% solids), mi = 0.002, and the penetration depth is 10.04 µm.
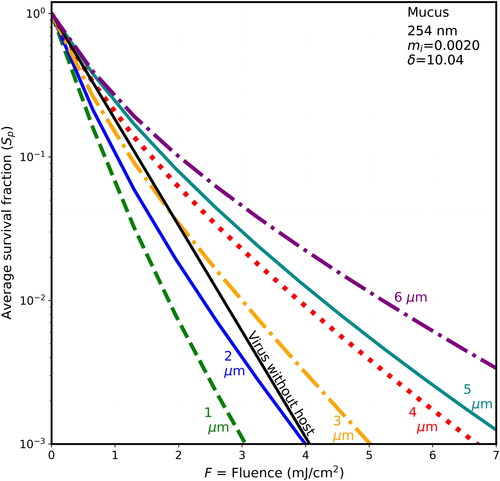
Figure 8. Average survival fractions (Sp) vs. F for 90-nm virions within spherical particles as in with λ = 254 nm, except the host sphere is nominally thick mucus with mi = 0.0075, and the penetration depth is 2.68 µm.
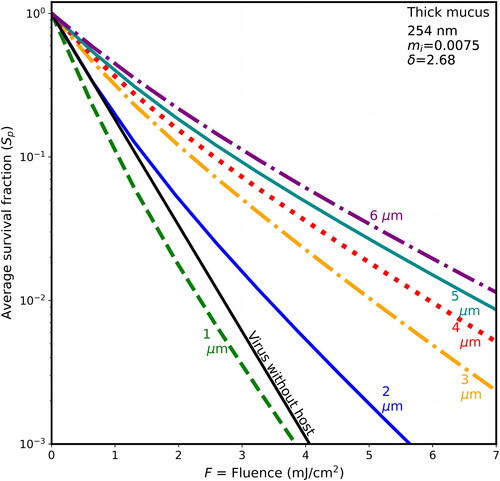
Figure 9. Average survival fractions in particles (Sp) vs. diameter (µm) for fluence = 2 mJ/cm2 at 222 nm (the upper four curves when the diameter is >1 µm), and at 254 nm in the lower two curves (except when d < 1 µm). In all cases, the virions are modeled as 90-nm spheres within spherical particles of the materials indicated. For the naked virus, the host sphere is also 90 nm (or 90 nm plus a number so small that it rounds to 90.0 nm). The lines guide the eye but do not indicate the results for points between the diameters indicated. UV rate constant for inactivation (k) is 2.3 cm2/mJ at 222 nm and is 1.7 cm2/mJ at 254 nm. The F = 2 mJ/cm2 could be obtained 1 min of UV at the limit I222_eye_86m = 2 mJ cm−2 min−1. For the 254 nm UV with the eye-limited irradiance I254_eye_86m = 0.0705 mJ cm−2 min−1 the F = 2 mJ/cm2 could be obtained 28.5 min.
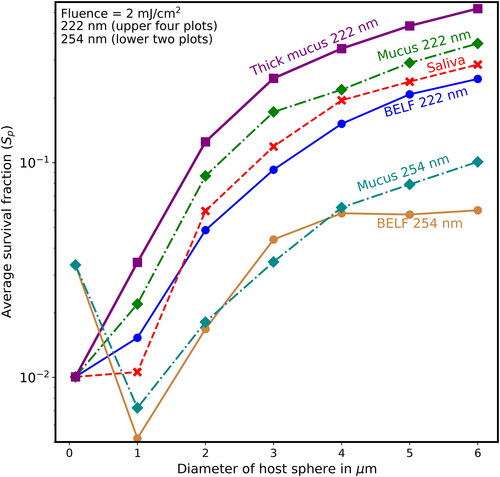
Figure 10. Average survival fractions (Sp) vs. diameter (µm) as in except that the lowest labeled value on the y-axis is 10−4, and the fluence is 4 mJ/cm2, which could be obtained with 2 min of UV at the limit I222_eye_86m = 2 mJ cm−2 min−1.
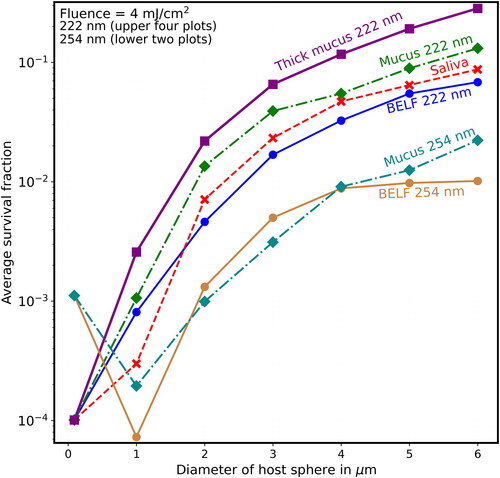
Figure 11. Average survival fractions (Sp) vs. diameter (µm) as in except that the lowest labeled value on the y-axis is 10−5, and the fluence is 6 mJ/cm2, which could be obtained with 3 min of UV at the limit I222_eye_86m = 2 mJ cm−2 min−1.
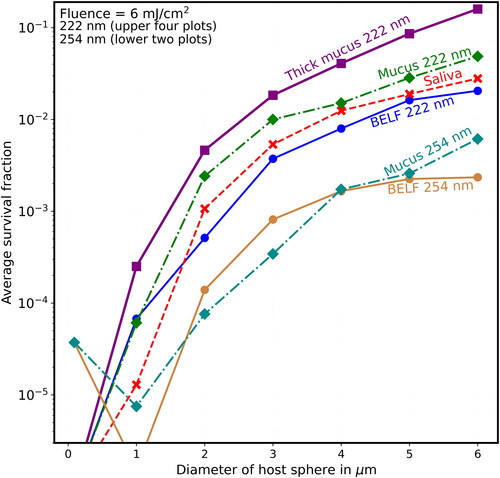
Figure 12. Average survival fractions (Sp) vs. diameter (µm) as in except that the lowest labeled value on the y-axis is 10−6, and the fluence is 8 mJ/cm2, which could be obtained with 4 min of UV at the limit I222_eye_86m = 2 mJ cm−2 min−1.
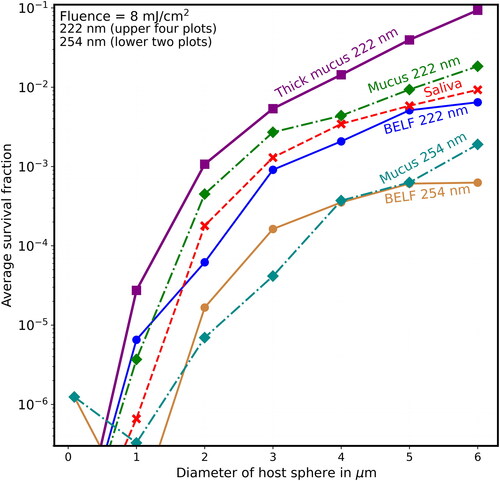
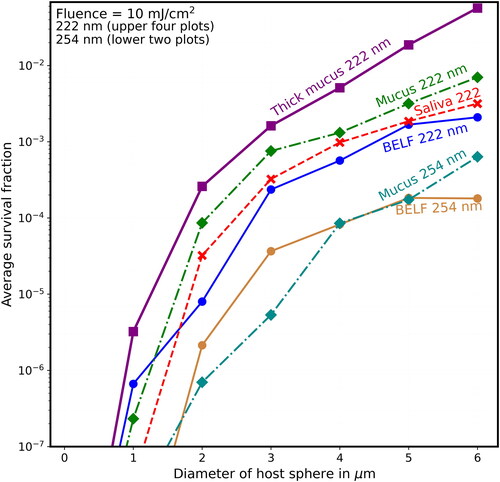
Figure 13. Average survival fractions (Sp) vs. diameter (µm) as in except that the lowest labeled value on the y-axis is 10−7, the highest labeled value on the y-axis is 10−2, and the fluence is 10 mJ/cm2, obtainable with 5 min of UV at the limit I222_eye_86m = 2 mJ cm−2 min−1.
Supplemental Material
Download MS Word (1.5 MB)Code availability
Researchers interested in the MSTM codes to calculate the Qabs for virions or other spheres inside of spheres can email D.W. Mackowski ([email protected]). Those interested in generating the input files used by the MSTM to generate the Qabs, i and Ri for the cases studied here, and in using these values to generate the Figures and/or Tables can email S. C. Hill or D. C. Doughty.