Figures & data
FIG. 1 Schematic diagram of the experimental system.
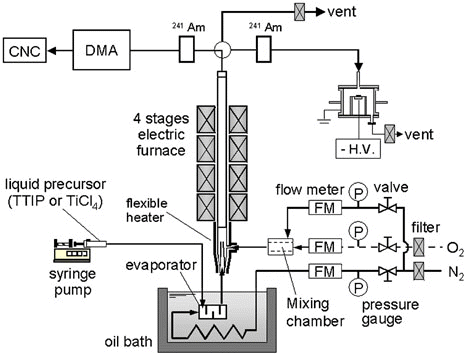
FIG. 2 TEM images of TiO2 nanoparticles prepared by the thermal decomposition of TTIP under various precursor concentrations. Change in primary particle diameter and geometric mean diameter obtained from TEM images with precursor concentration.
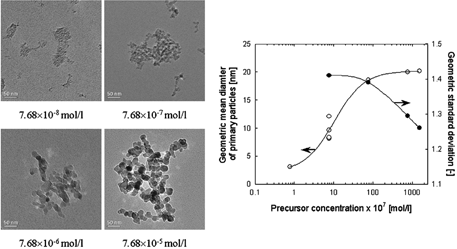
FIG. 3 Change in particle size distributions as a function of TTIP precursor concentration obtained from DMA/CNC system.
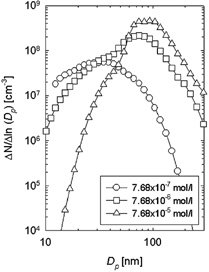
FIG. 4 X-ray diffraction pattern of titania nanoparticles under various precursor concentrations (source gas: TTIP).
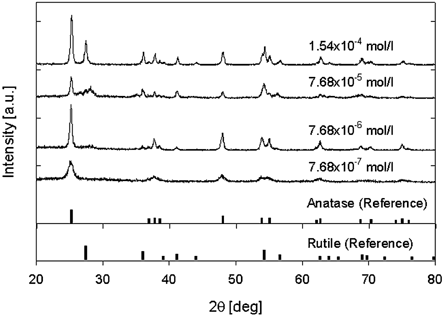
FIG. 5 TEM images of TiO2 nanoparticles prepared by the thermal decomposition of TTIP under various total flow rates. Change in primary particle diameter and geometric mean diameter obtained from TEM images with total flow rates.
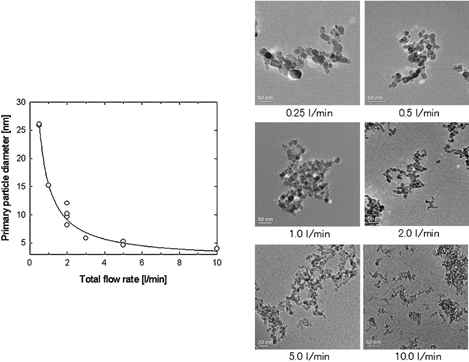
FIG. 6 X-ray diffraction pattern of titania nanoparticles under various total flow rates (source gas: TTIP).
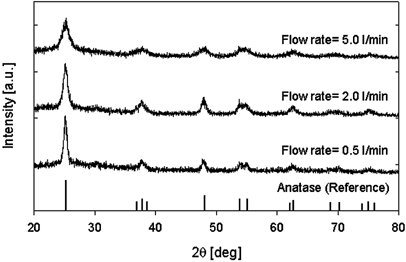
FIG. 7 TEM images of TiO2 nanoparticles prepared by the oxidation of TiCl4 under various precursor concentrations. Change in primary particle diameter and geometric mean diameter obtained from TEM images with precursor concentration.
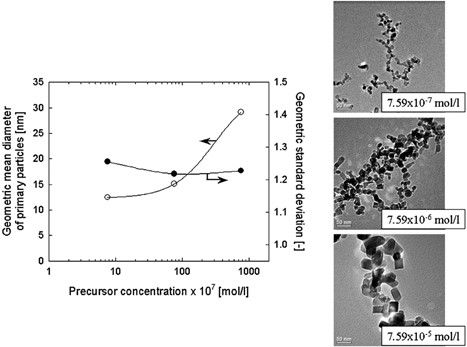
FIG. 8 X-ray diffraction pattern of titania nanoparticles under various total flow rates (source gas: TiCl4).
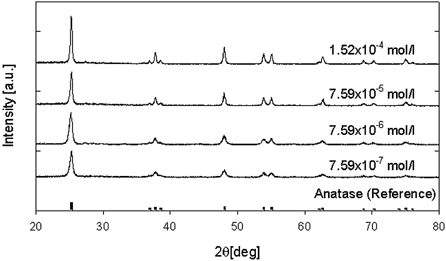
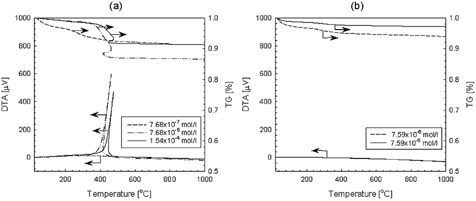
FIG. 9 TG-DTA curves of titania nanoparticles prepared by the thermal decomposition of TTIP (a) and the oxidation of TiCl4 (b) at various precursor concentrations.