Figures & data
TABLE 1 Summary of PM2.5 mass concentrations (μg m−3) of the continuous samplers at the sites
FIgure 1 One hour measurements of concentrations of PM2.5 mass and semivolatile nitrate and OC in Atlanta, GA, along with particle light scattering. The RAMS mass concentrations were adjusted by a factor of 1.64.
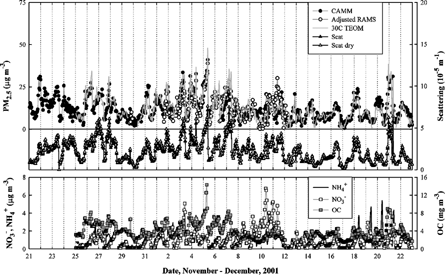
FIgure 2One hour measurements of concentrations of PM2.5 mass and semivolatile nitrate and organic carbon in Philadelphia, PA, along with particle light scattering and meteorological parameters.
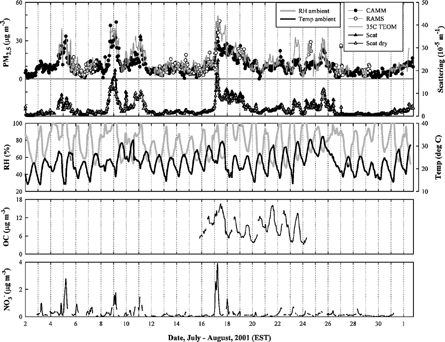
FIgure 3One hour measurements of concentrations of PM2.5 mass and semivolatile nitrate in Baltimore, MD, along with particle light scattering and meteorological parameters.
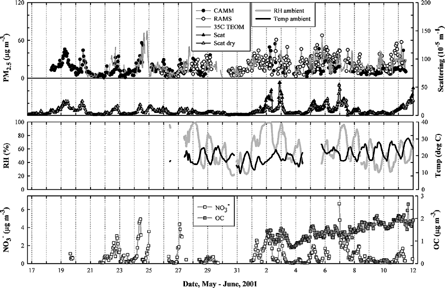
FIgure 4Twelve hours moving averaged (MA) PM2.5 mass concentrations at the sites.
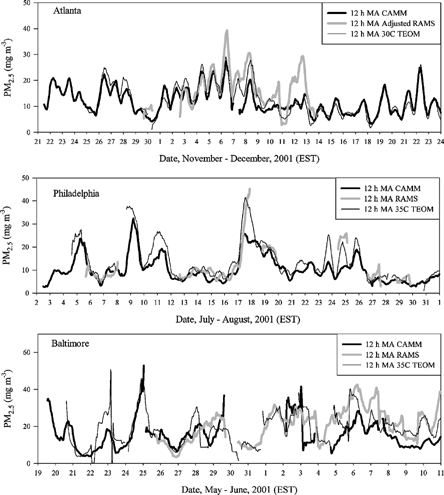
FIgure 5Intersampler comparison among the CAMM, RAMS, and TEOM PM2.5 mass. The RAMS values in Atlanta were adjusted by a factor of 1.64.
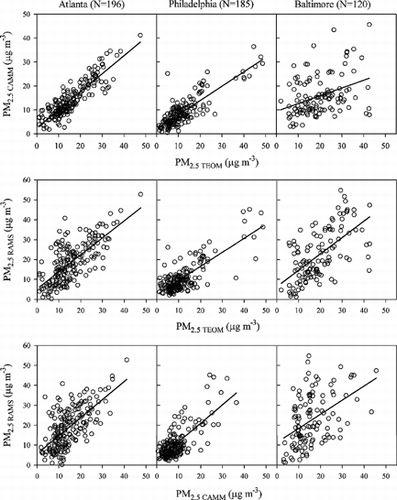
TABLE 2 Linear regressions of continuous PM2.5 mass concentrations
TABLE 3 Similarity (coefficient of divergence, COD) between each pair of samplers for PM2.5 mass measurements
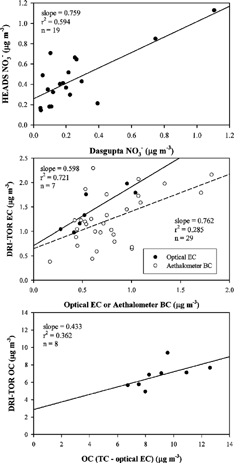
FIgure 6Continuous versus integrated (a) particulate nitrate and (b) OC concentrations in Atlanta.
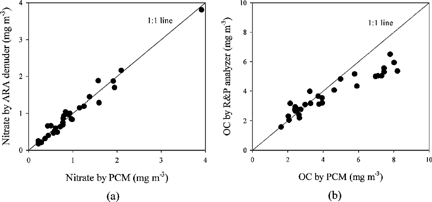
FIgure 7Scatterplots of particle scattering from nephelometers with and without a drier.
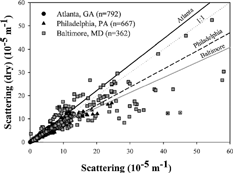
TABLE 4 Comparison of dried and wet light scattering (10−5 m−1) in the three eastern US cities
FIgure 8Comparison of continuous and integrated PM2.5 mass concentrations.