
Figures & data
Figure 1. Graphs of quantitative analysis of ketamine and metabolites in breast milk for all four participants. Each data point shown as mean ± SD.
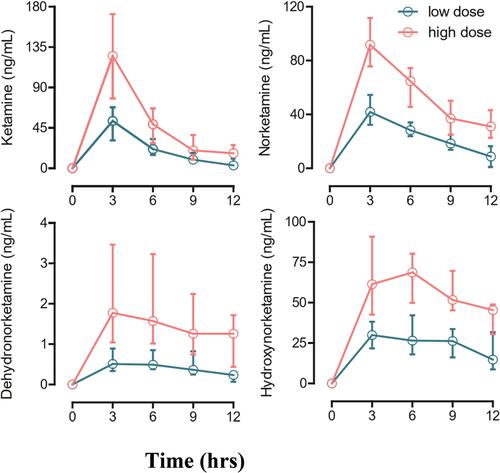
Table 1. Breast milk concentrations (ng/ml) of ketamine and metabolites. Concentrations reported as mean ± standard deviation.
Table 2. Mean AUC0-12 calculations of ketamine and metabolites in breast milk.
Supplemental material