
Figures & data
Figure 1. Dendogram with the 25 words with highest χ2 in each cluster.
Large (red), medium (blue), and small (green) effect sizes, according to Kim (Citation2017).
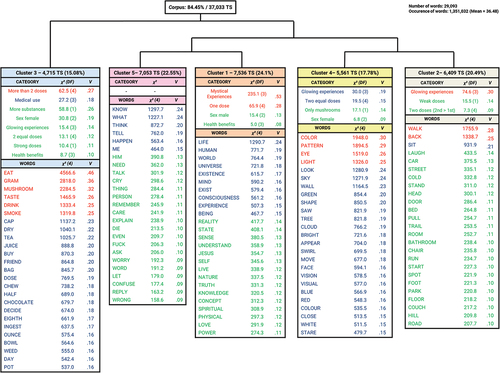
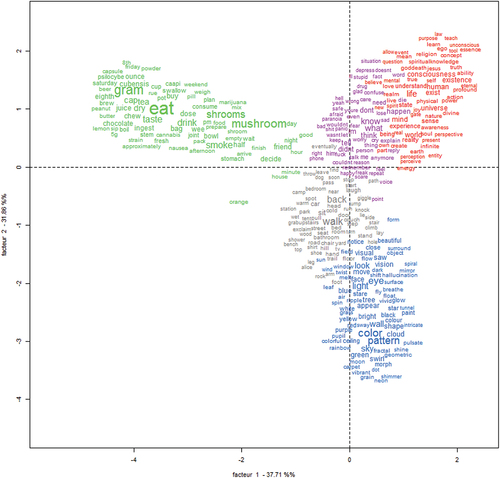
Figure 2. Relationship between clusters and words in each cluster.
Red – Cluster 1; gray – Cluster 2; green – Cluster 3; blue – Cluster 4; pink – Cluster 5
Supplemental material