Figures & data
Figure 1. Flow diagram. 1“Other individual FP reasons” refers to those exclusions made at the specific instigation of the FP for individual reasons of comorbidity, psychosocial reasons, high age, severe disability, currently not in the practice.
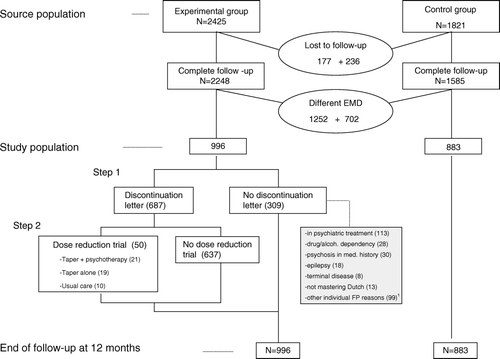
Table I. Charateristics of study subjects.
Table II. Average number of contacts (SD) per three-month period in the experimental group (n = 996) and the control group (n = 883).
Table III. Average number of prescriptions1 (SD) per three-month period in the experimental group (n = 996) and the control group (n = 883).