
Figures & data
Table 1. Characteristics of the 843 GPs in the central Denmark region divided into respondents and non-respondents.
Table 2. Frequency of GP-reported provision of 'end of life care' to three different patient groups (N = 573 GPs).
Table 3. The distribution of answers according to confidence and different elements about being a key worker (N = 571 GPs).
Figure 1. Percentage of GPs who reported to feel confident/very confident taking care of nine different elements of EOL care (N = 571 GPs).
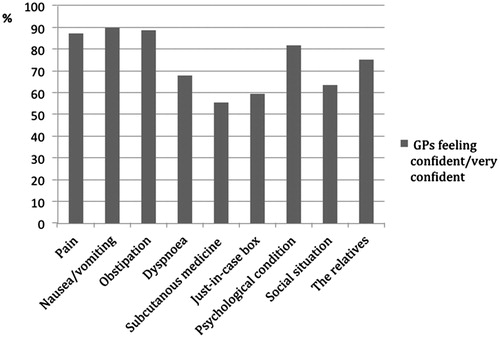
Table 4. Associations between GP characteristics and five different questions about EOL care clustered on provider number.