
Figures & data
Figure 1. Chart showing inclusion/exclusion criteria, completers/non-completers, and respondents/non-respondents to the questionnaires.
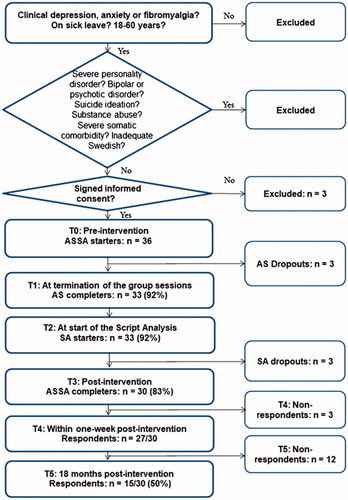
Table 1. Prevalence of depression, anxiety, and alexithymia at baseline (T0), within one-week post-intervention (T4), and at 18 months post-intervention (T5).
Table 2. Test scores at baseline (T0), within one-week post-intervention (T4), and at 18 months post-intervention (T5).
Table 3. Baseline analyses of associations between scores for HADS-D, HADS-A, TAS-20, and for SCI-93 scores for the 36 ASSA starters (T0).
Detailed protocol for the 8 group-based sessions – the Affect School