Figures & data
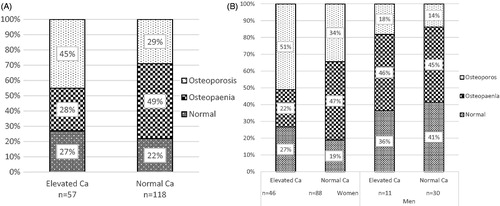
Figure 1. Flow chart of study subjects, including drop-outs, with elevated and normal calcium concentrations at base line at Tibro Health Care Centre, Sweden: first investigation in 1995–2000, and re-examination in 2009–2010.
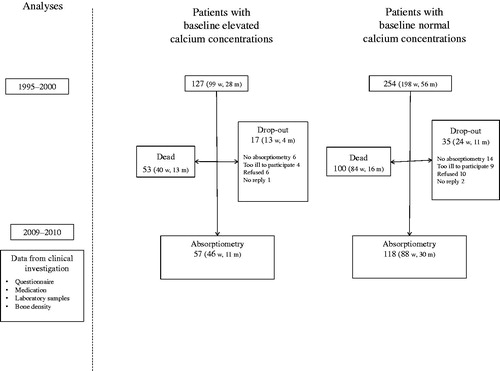
Table 1. Characteristics of patients with elevated and normal calcium concentrations at baseline, 1995–2000 and 2008–2010, men and women, at Tibro Health Care Centre, Sweden.
Table 2. Clinical characteristics and bone mineral variables, 2009–2010, in patients with elevated and normal calcium concentrations at baseline, 1995–2000 and 2008–2010, men and women, at Tibro Health Care Centre, Sweden.
Figure 2. Patients with elevated and normal calcium concentrations divided at baseline into three groups, depending on the results of the absorptiometry: normal bone density ≥ −1 SD, osteopaenia: < −1.0 SD and > −2.5 SD, osteoporosis: ≤ −2.5 SD. Re-examination in 2009–2010 of patients from Tibro Health Care Centre, Sweden. Panel A. All patients. Panel B. Patients divided by gender.