Figures & data
Figure 1. Schematic patient selection.
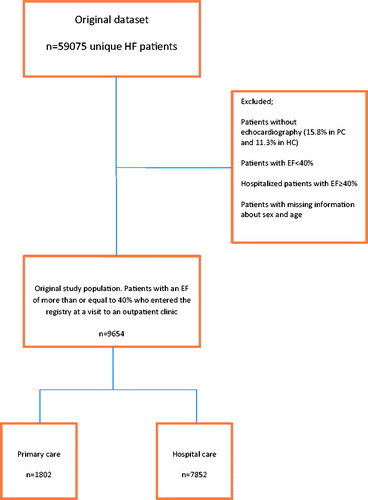
Table 1 Characteristics in patients with an EF equal to or above 40%, overall and matched cohorts.
Figure 2. Survival curves (Kaplan-Meier method) illustrating all-cause mortality in primary care based and hospital care based outpatients, the overall cohorts separately.
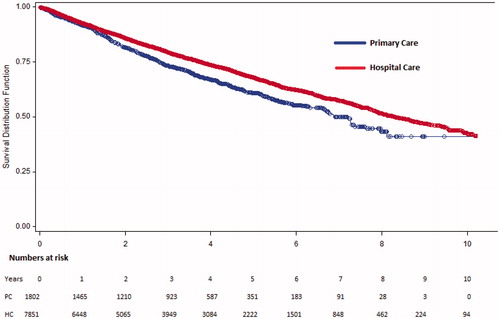
Table 2. All cause mortality rates in out-patients with an EF of more than or equal to 40%.
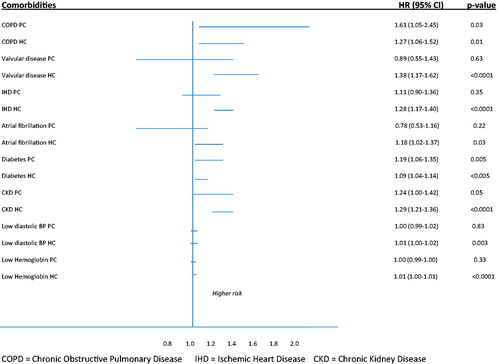
Figure 3. Hazard ratios with 95% CI indicating potential impact of co-morbidities on all-cause mortality in PC and HC overall cohorts.