
Figures & data
Figure 1. Study cohort.
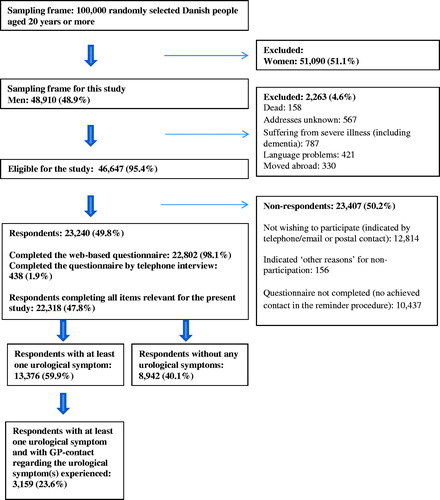
Table 1. The top half shows some of the characteristics of the study sample. The bottom half provides an overview of self-reported urological symptom experiences with regard to the three covariates and GP contact.
Table 2. Number of urological symptoms and number of symptoms with GP-contact stratified on age (above/below 60 years).
Table 3. Odds Ratios (ORs) for GP contact for all reported urological symptoms (n = 23 070) with regard to symptom concern, influence on daily activities, symptom persistence and symptom burden.
Table 4. Odds Ratios (ORs) for GP contact for reported urological symptoms with regard to symptom concern, influence on daily activities and symptom persistence, stratified on symptom type. N = number of symptoms.