
Figures & data
Figure 1. Flowchart of the study population. The number of CRC diagnoses for each subgroup is stated for the year following the screening invitation.
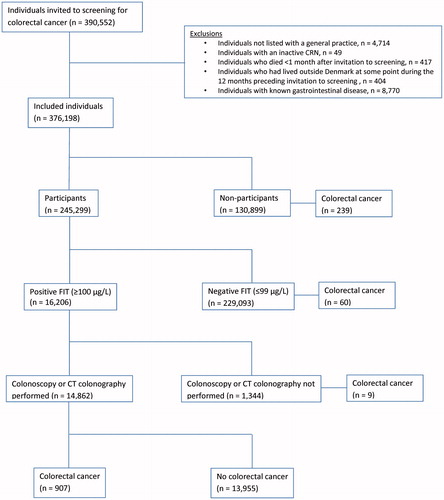
Figure 2. (A-C) Mean rates of daytime face-to-face consultations and haemoglobin measurements for subgroups in the screening for CRC. Estimates are for 3-month intervals, 12 months preceding invitation to screening. The upper graph illustrates the unadjusted average consultation rate for individuals in subgroups. The lower graph illustrates the IRRs for comparison of subgroups adjusted for age, gender, country of origin, educational level, labour market affiliation, marital status, CCI score, prescriptions of medicine against haemorrhoids, NSAIDs, acetylsalicylic acids and anticoagulant drugs.
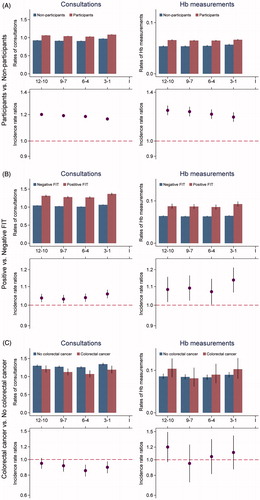
Table 1. Characteristics of individuals included in the analyses on diagnostic activity.
Figure 3. Cumulative incidence of CRC among individuals invited for screening participation, one year following invitation. Incidence was stratified for screening participation. In total, 907 CRCs were diagnosed in the screening (red curve) and 308 CRCs were diagnosed outside the screening (blue and green curves).
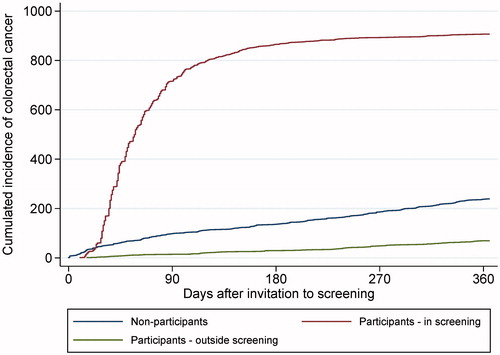
Table 2. Characteristics for individuals diagnosed with CRC in the year following the screening invitation.