
Figures & data
Figure 1. Description of the four 38- and 50-year-old age groups of women examined in the Population Study of Women examinations in 1980–81 and 2004–05, respectively. Year of birth, number of invited women and number of women who participated in the respective examinations.
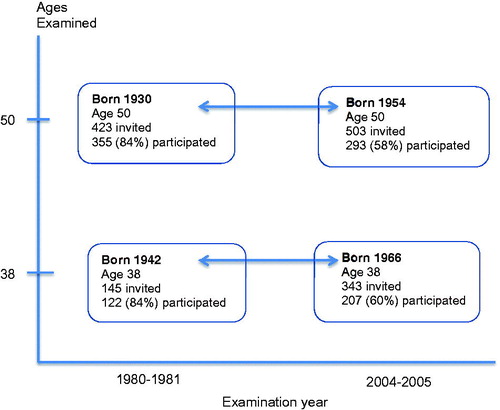
Figure 2. Change in the proportion of women who belonged to low/high physical activity group at work and leisure time, from 1980–81 to 2004–05 for socio-occupational group low, medium, and high, respectively, 38-year-olds (a-d) and 50-year-olds (e-h).
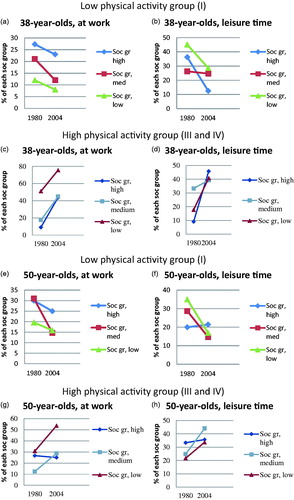
Table 1. Characteristics of 38- and 50-year-old women in the Population Study of Women in Gothenburg regarding the assessments performed in 1980–81 and 2004–05, respectively.
Table 2. The association between: (a), low (I) vs. high (II, III, IV) physical activity (outcome) at work/leisure time, (b), high (III, IV) vs. low (I, II) physical activity (outcome) at work/leisure time, and low/high socio-occupational group and low/high education group, respectively, defined as the exposed group. Odds ratios (OR) with 95% confidence intervals (CI).(a) Low physical activity (I) versus (II, III and IV).
(b) High physical activity (III, IV) versus low (I, II).
Table 3. Odds for increase over time (from 1980-81 to 2004-05) in mean physical activity level (using the four levels of the activity scale) at work and leisure time for 38- and 50-year-old cohorts, adjusted for socio-occupational group and educational level, respectively. Odds ratios (OR) with 95% confidence intervals (CI).