Figures & data
Figure 1. Flowchart of study participant selection and randomisation.
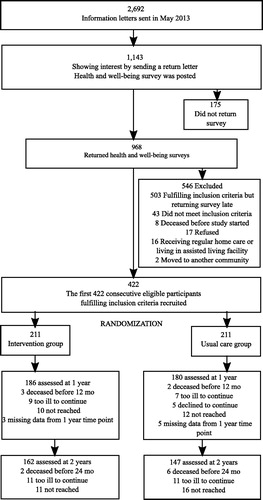
Table 1. Components of the home visit intervention, specific instructions given, and the number of participants who received specific instructions in addition to general information.
Table 2. Characteristics of participants at baseline.
Figure 2. Effects of the intervention on the change in health-related quality-of-life on a 15D scale during a two-year follow-up period.
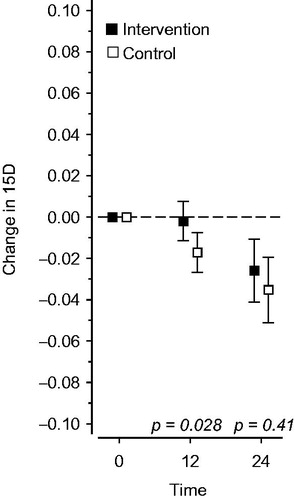
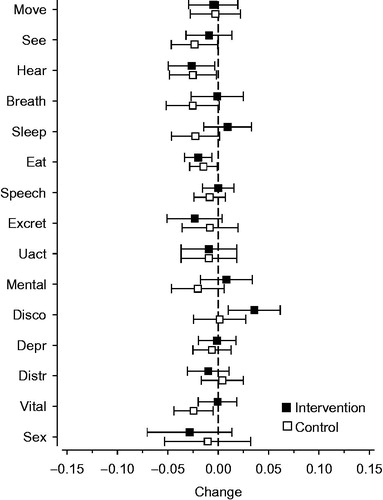
Figure 3. Effects of the intervention on the dimensions of a 15D scale at the one-year time point.