
Figures & data
Table 1. Model fit statistics for MDI items.
Table 2. Individual item fit for MDI items.
Figure 1. The MDI category probability curves for item 1 ‘feeling sad’ displaying disordered six-point response categories and corrected five-point response categories.
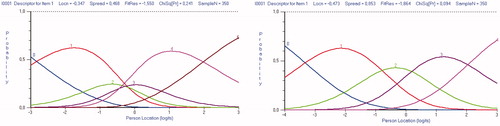
Figure 2. All 10 MDI items displayed disordered six-point response categories and corrected five-point response categories (A). Dichotomization according to diagnostic algorithm revealed ordered response categories (B). All items are sorted in location order.
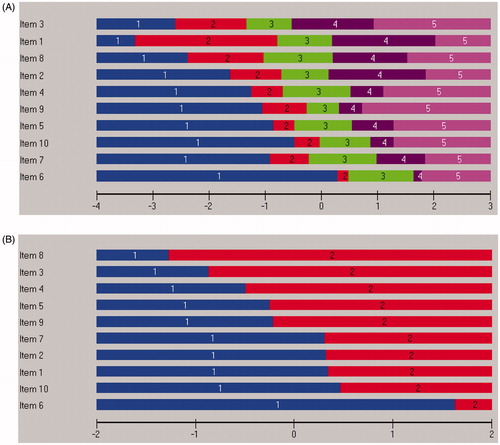
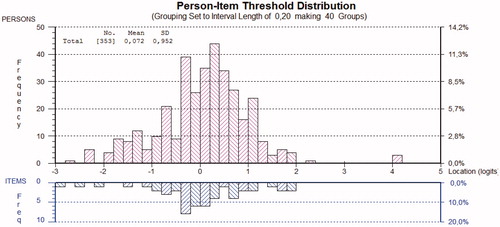
Figure 3. The person-item threshold map for the MDI items for the primary care sample. A total of 57% of persons were classified as clinically depressed according to the MDI algorithm.
Supplemental material