Figures & data
Table 1. Characteristics of the Somali women, n = 114, living in Sweden, and native Swedish women, n = 69 as comparison group: other diseases, medication, laboratory data and Health-Related Quality of Life measured using Short Form-36 and EQ-5D. Means ± SD and percentages (%) are given.
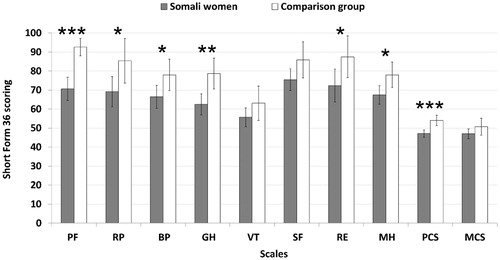
Figure 1. Health-Related Quality of Life measured using Short Form-36 in Somali women living in Sweden >2 years and women from the World Health Organization, MONItoring of trends and determinants for CArdiovascular disease (WHO MONICA) study, Gothenburg, Sweden as a comparison group. PF: Physical Function; RP: Role Physical; BP: Bodily Pain; GH: General Health; VT: Vitality; SF: Social Function; RE: Role Emotional; MH: Mental Health; PCS: Physical Component Summary score including PF, RP, BP and GH; MCS: Mental Component Summary score including VT, SF, RE and MH. Means ± SD are given. *p < .05; **p < .01; ***p < .001 for age-adjusted data.