
Figures & data
Figure 1. Flow chart of the Muonio-Enontekiö District study population.
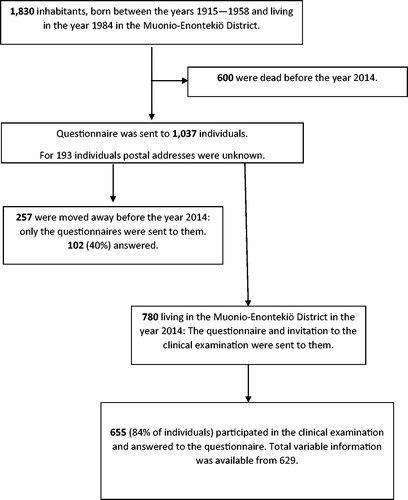
Table 1. Characteristics of the study subjects (n = 629).
Table 2. The prevalence of depressive symptoms (BDI-II ≥14 points) among those men and women living still in Muonio-Enontekiö district at 2014 and those who had moved away from area.
Figure 2. Forest plots showing the OR and 95% CI of depression with different glucose metabolism status.
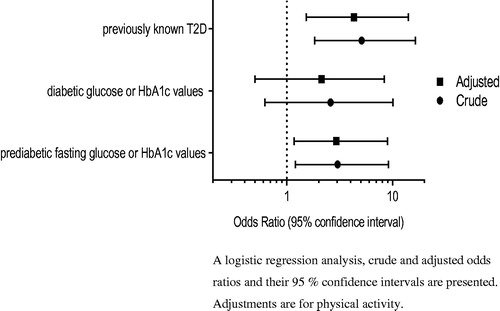
Table 3. Dependent variable: Depressive participants (BDI at least 14): excluded those who moved away from the Muonio-Enontekiö district.