
Figures & data
Figure 1. Map of the geographical area with hospitals, roads and HEMS bases. Link to map of HEMS bases in Norway with 30 minutes flying time circles. http://www.luftambulanse.no/sites/default/files/LAT-kart-2015.pdf
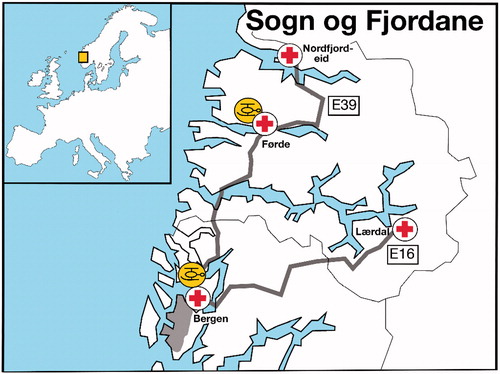
Figure 2. Flowchart showing included missions and patients.
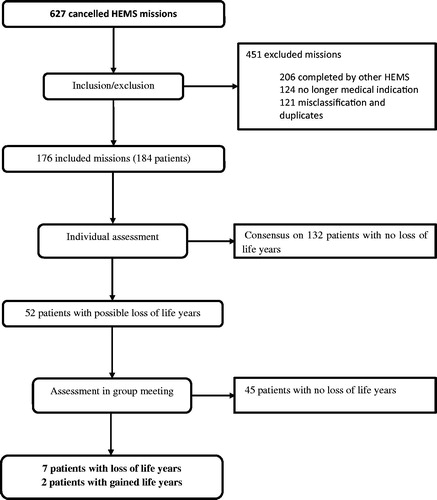
Table 1. Demographic data on included patients. In the first assessment the patients (n = 184) were divided by the experts between the groups “possible life years lost” and “no life years lost”; gender, mission type, patient’s location and type of patient when HEMS was alerted.
Table 2. Patients with an estimated loss of life years, main emergency medical condition, reasons for estimated loss of life years and mission type for 9 missions.