Figures & data
Figure 1. (A) Total number of GP visits per 1000 65+ year-old inhabitants in Vantaa during 2003–2014. (B) Total visits divided per person per year, describing how many visits one 65+ has per year on average in Vantaa in during 2003–2014.
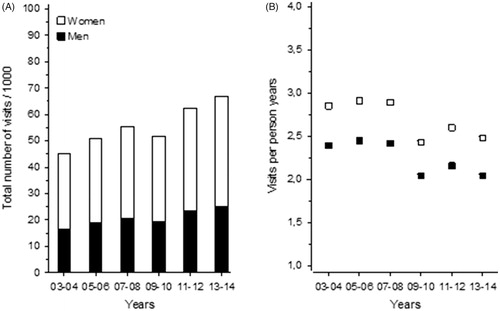
Figure 2. Visit rate ratios of GP visits in the years 2003–2014: (A) age group of 65–69 year-olds, (B) age group of 70–74 year-olds, (C) age group of 75–79 year-olds, (D) age group of 80–84 year-olds, (E) age group of ≥85 year-olds. The years 2003–2004 are used as reference and 95% confidence intervals are shown with brackets.
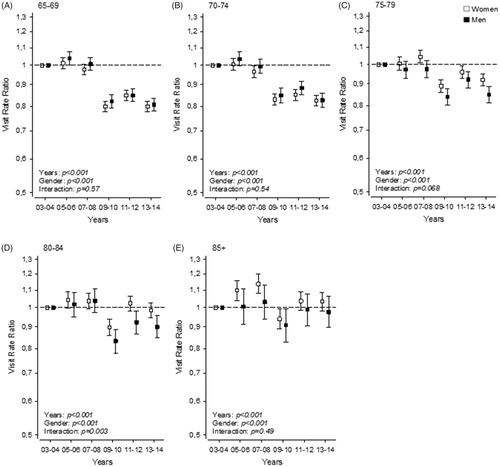
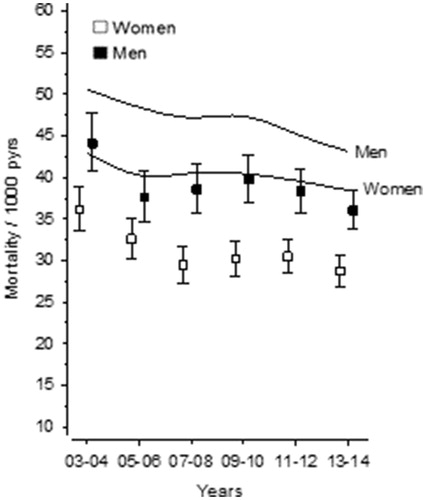
Figure 3. Mortality rate per 1000 persons per year of 65+ in the whole of Finland (curves indicating men and women) compared to mortality rate per 1000 persons per year of 65+ in Vantaa during 2003–2014.