
Figures & data
Table 1. Baseline data for patients included in WorkUp, n = 352.Table Footnotea
Table 2. The mean difference in function, HRQoL and work ability between the intervention and the reference group.a
Figure 1. Mean outcome per treatment group over follow-up time with 95% confidence interval estimated by the regression model regarding function as measured by FRI.
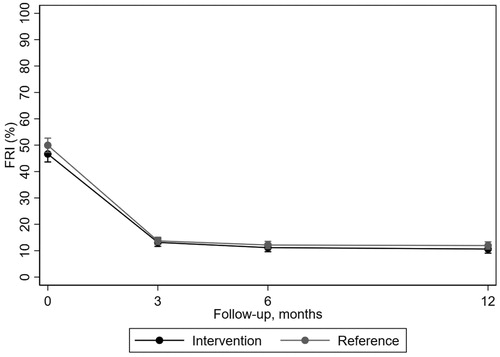
Figure 2. Mean outcome per treatment group over follow-up time with 95% confidence interval estimated by the regression model regarding health-related quality of life as measured by EQ-5D.
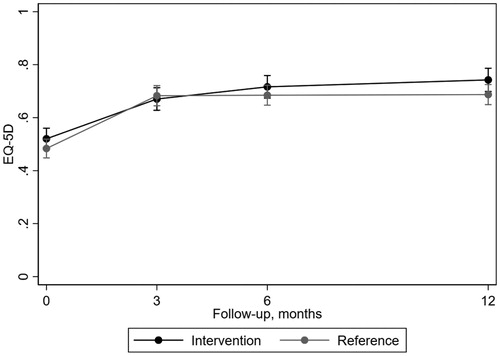
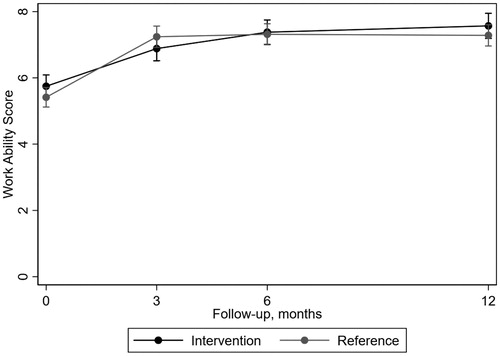
Figure 3. Mean outcome per treatment group over follow-up time with 95% confidence interval estimated by the regression model regarding work ability as measured by work ability score (WAS).
Supplemental material