
Figures & data
Table 1. 31 drug–disease interactions that were assessed for their prevalence.
Figure 1. Time frames for assessment of diseases.
GERD: Gastroesophageal reflux disease
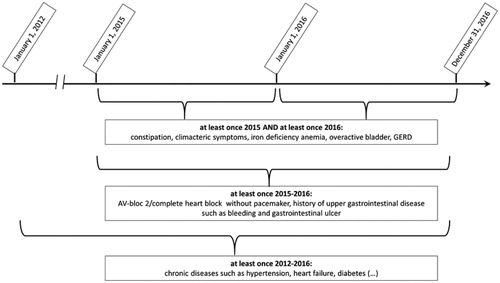
Table 2. Basic characteristics of study population (n = 336,295).
Figure 2. (a,b) Number of patients with drug-disease interaction in the total population (2a) and grouped by interacting disease (2 b) (total population n = 336,295). For corresponding numbers: see appendix, Tables 2 and 3. (a) Prevalence of the 20 most commonly seen drug-disease interactions.
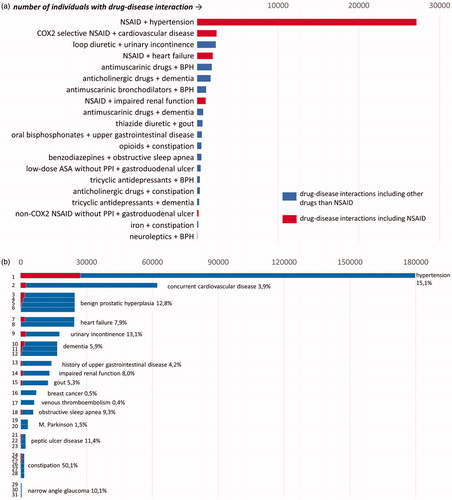
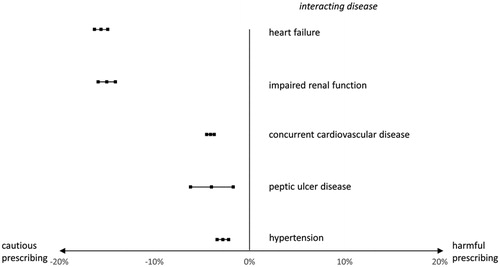
Figure 3. Prevalence differences and 95% confidence intervals of NSAID use in patients with a pain diagnosis and with/without an interacting disease.
Supplemental material